Introduction and data structure
Credit Risk Modeling in R

Lore Dirick
Manager of Data Science Curriculum at Flatiron School
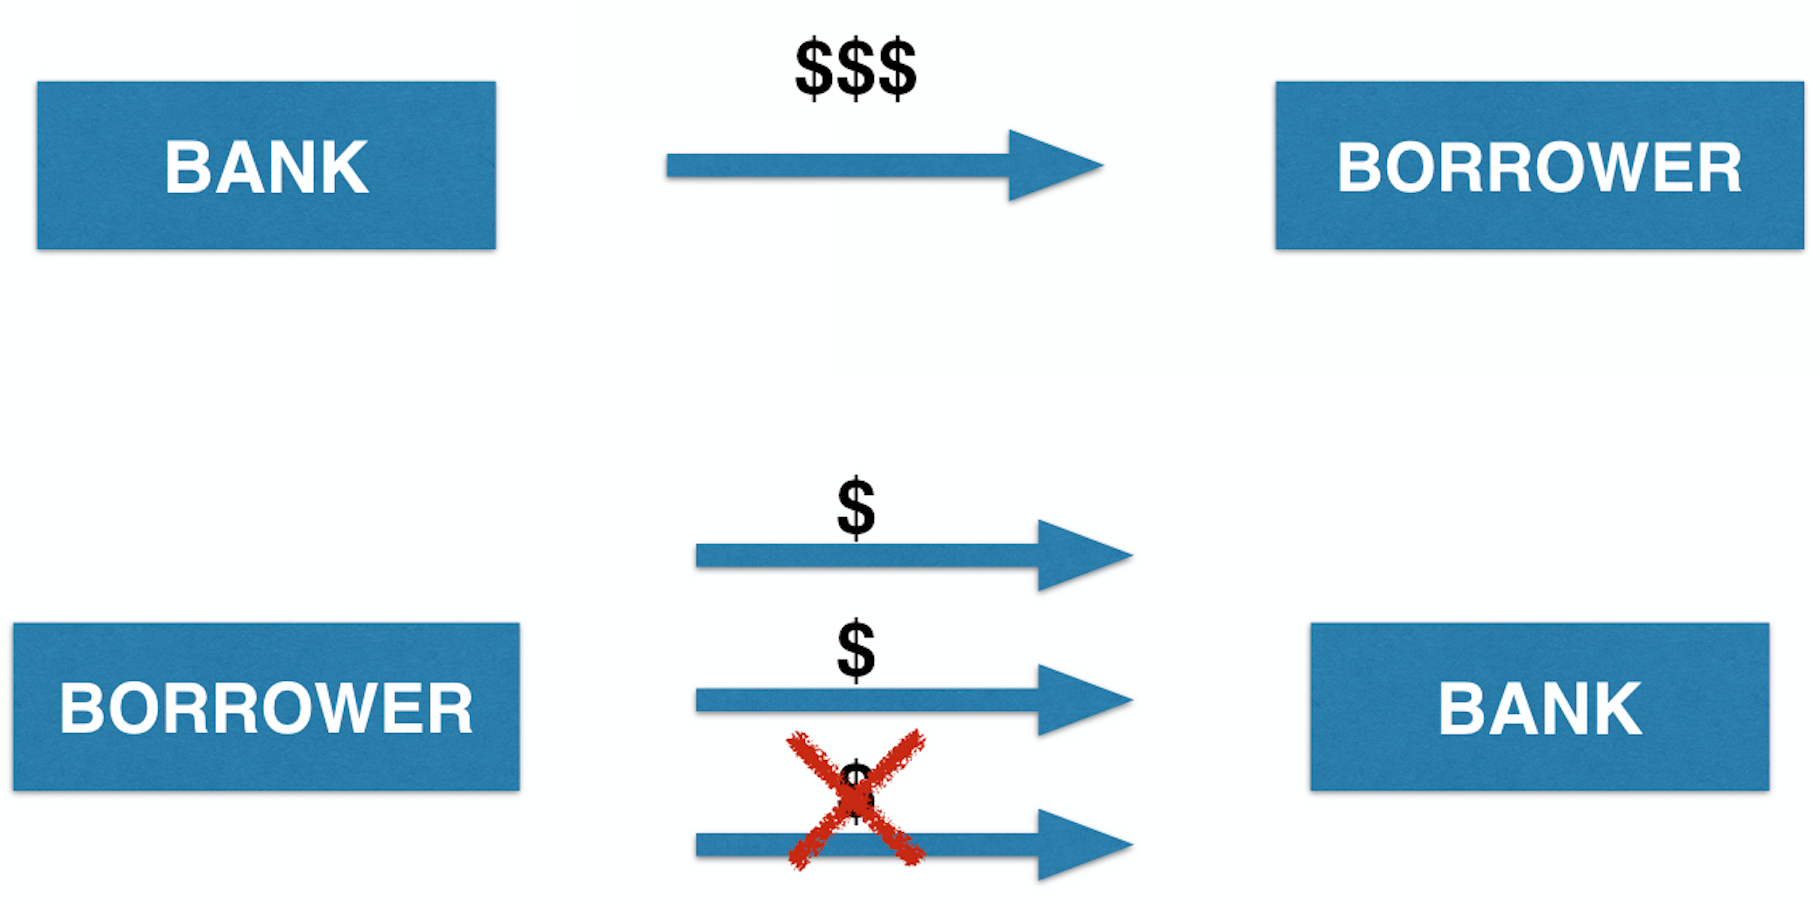
What is loan default?
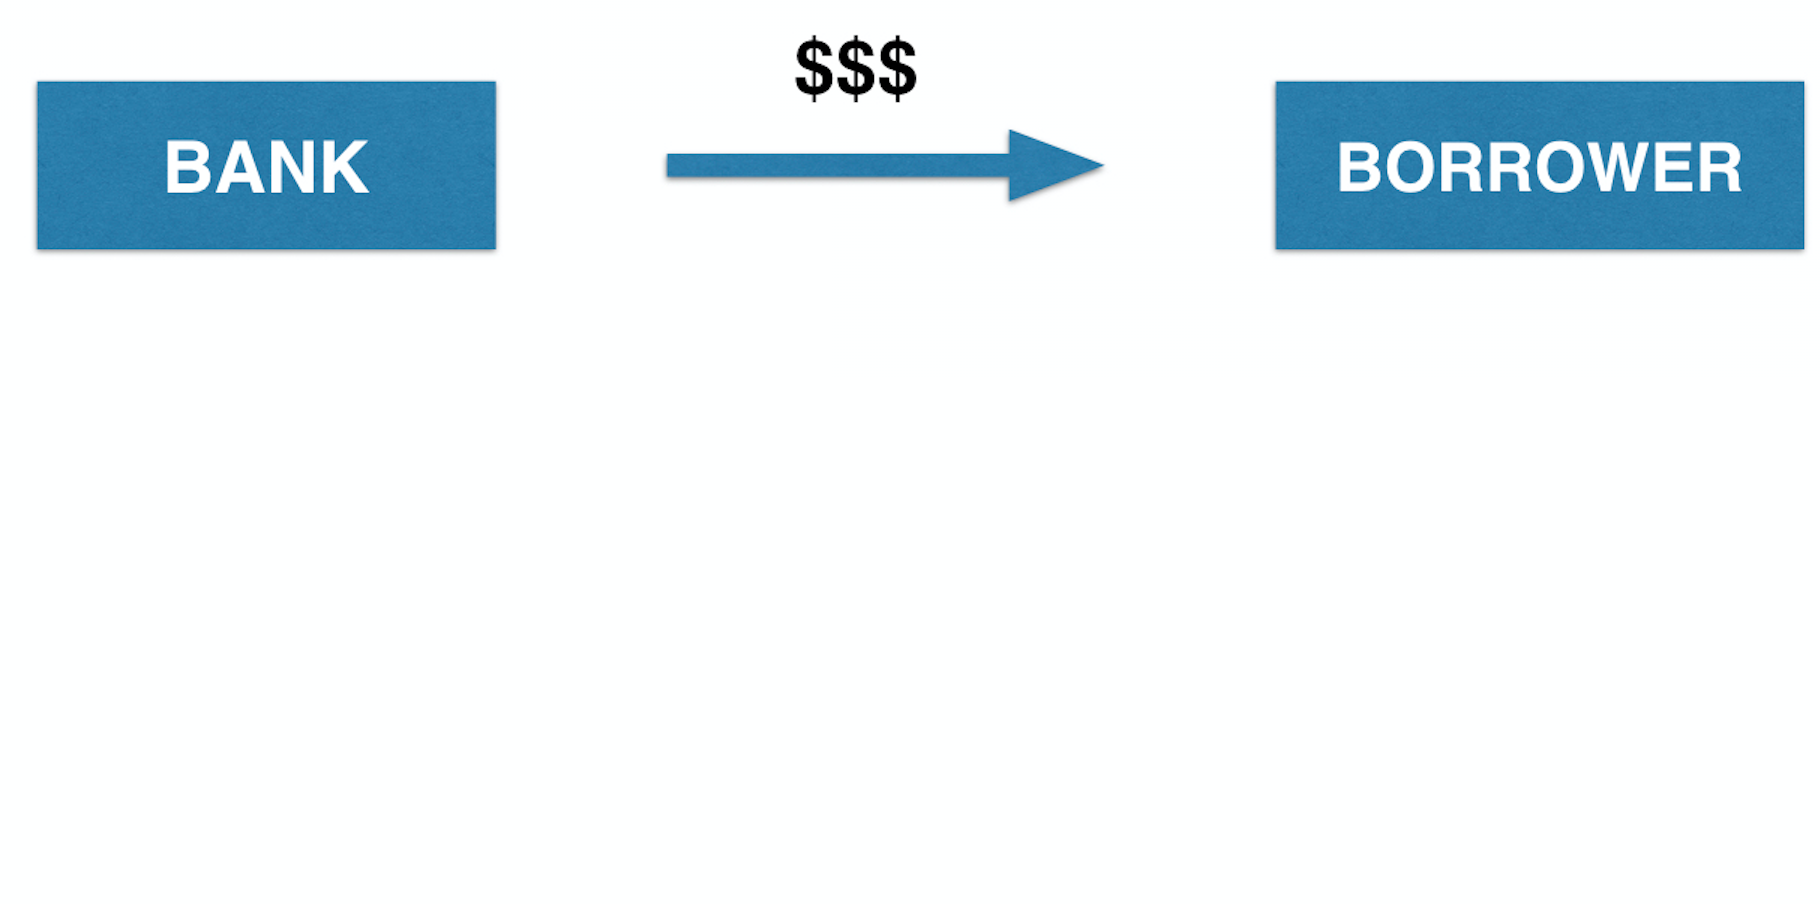
What is loan default?
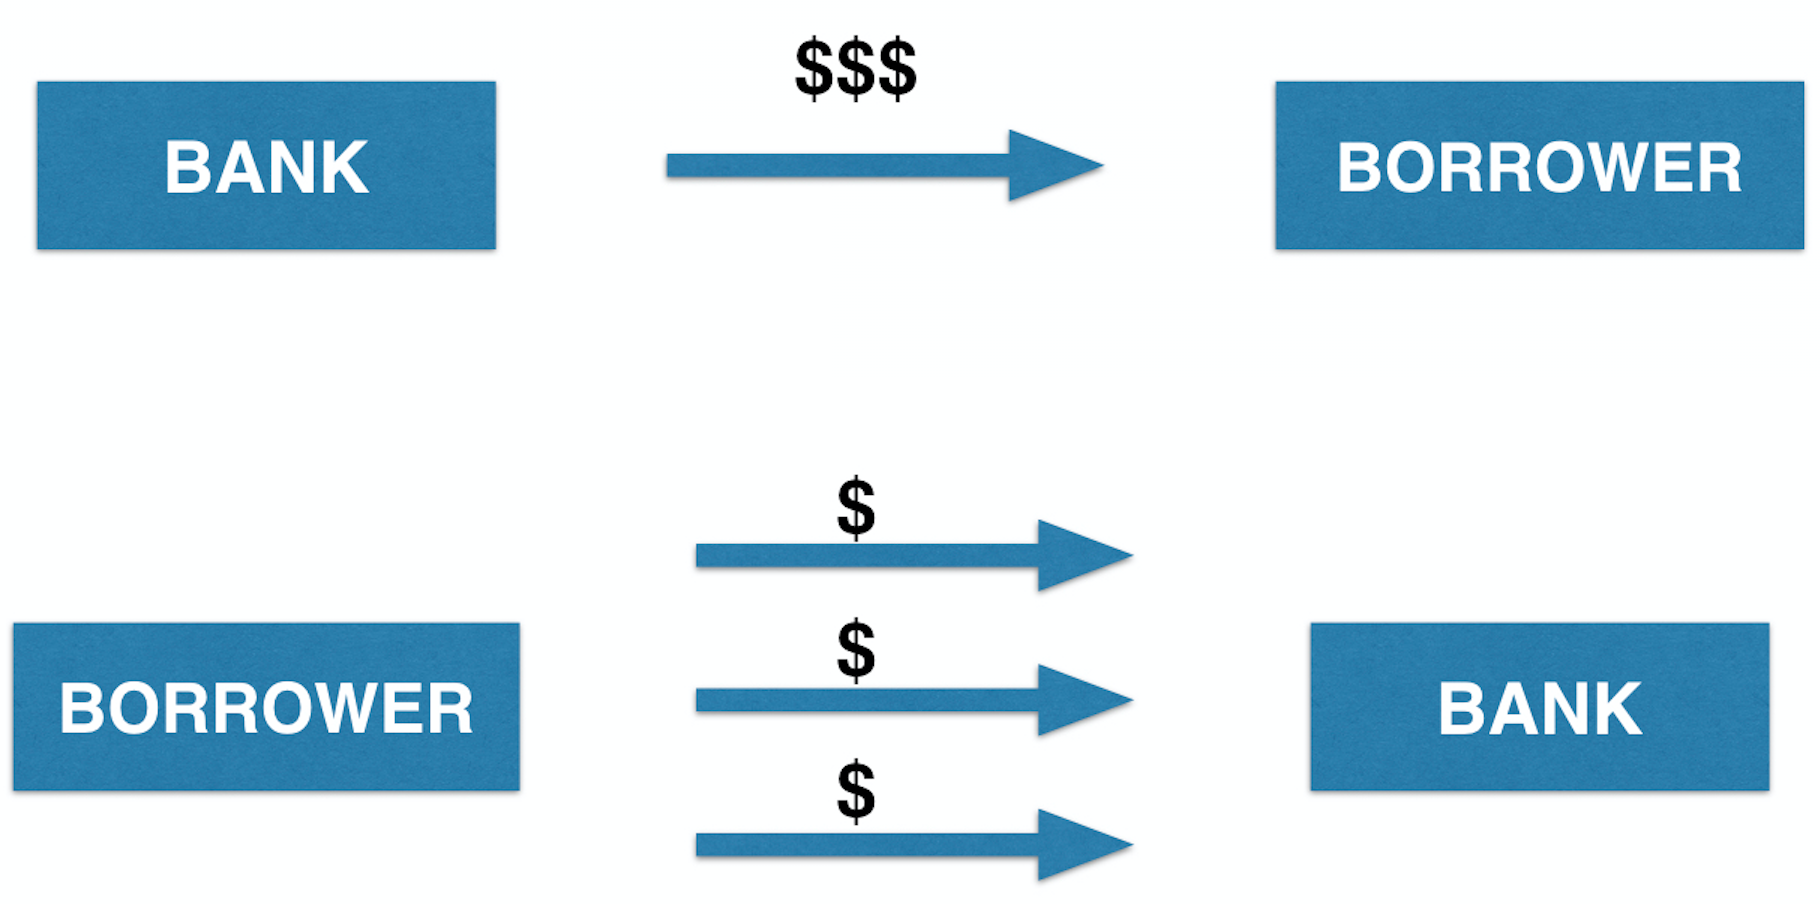
What is loan default?
Credit Risk Modeling in R
Lore Dirick
Manager of Data Science Curriculum at Flatiron School

