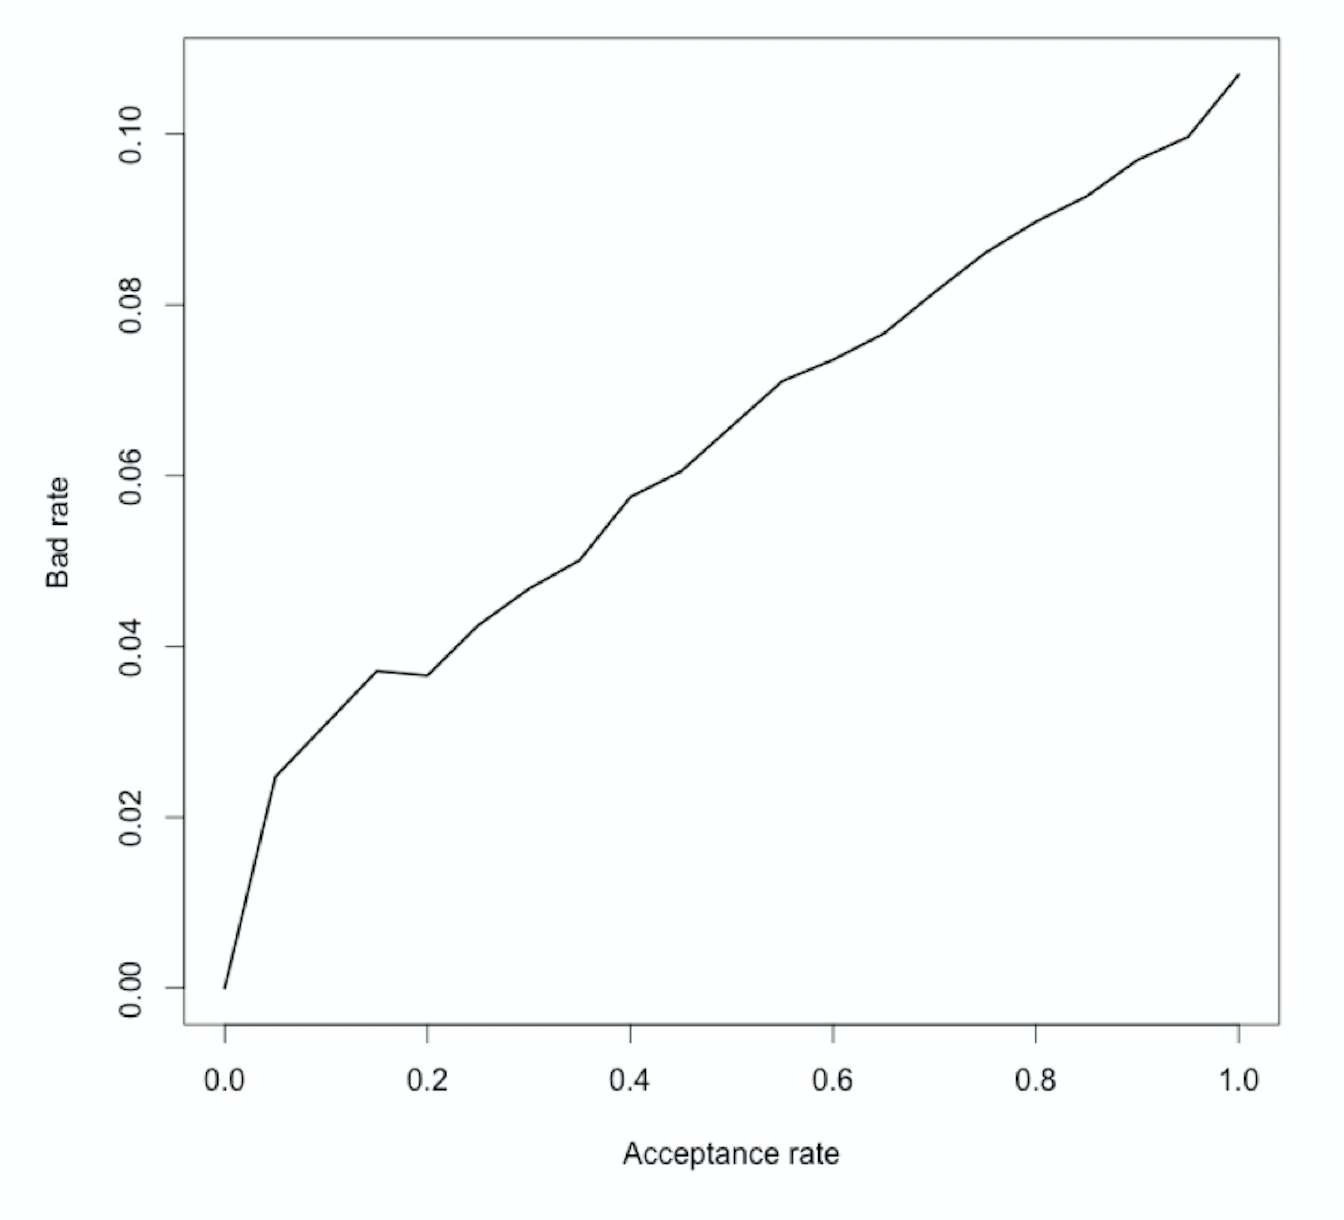
Finding the right cut-off: the strategy curve

Credit Risk Modeling in R

Lore Dirick

Manager of Data Science Curriculum at Flatiron School

Constructing a confusion matrix

predict(log_reg_model, newdata = test_set, type = "response")
 1          2          3          4          5          ...
0.08825517 0.3502768 0.28632298 0.1657199 0.11264550    ...
predict(class_tree, new data = test_set)
          0         1
1 0.7873134 0.2126866
2 0.6250000 0.3750000
3 0.6250000 0.3750000
4 0.7873134 0.2126866
5 0.5756867 0.4243133
Credit Risk Modeling in R

Cut-off?

pred_log_regression_model <- predict(log_reg_model, 
                                     newdata = test_set, 
                                     type = "response")

cutoff <- 0.14

class_pred_logit <- ifelse(pred_log_regression_model > cutoff, 1, 0)
Credit Risk Modeling in R

A certain strategy

log_model_full <- glm(loan_status ~ ., family = "binomial", data = training_set)

predictions_all_full <- predict(log_reg_model, newdata = test_set, type = "response")

cutoff <- quantile(predictions_all_full, 0.8)
cutoff
      80% 
0.1600124
pred_full_20 <- ifelse(predictions_all_full > cutoff, 1, 0)
Credit Risk Modeling in R
true_and_predval <- cbind(test_set$loan_status, pred_full_20)
true_and_predval
     test_set$loan_status    pred_full_20
1           0                     0
2           0                     0
3           0                     1
4           0                     0
5           0                     1                    
...           ...                     ...
accepted_loans <- true_and_predval[pred_full_20 == 0,1]
bad_rate <- sum(accepted_loans)/length(accepted_loans)
bad_rate
0.08972541
Credit Risk Modeling in R
accept_rate  cutoff  bad_rate
 [1,]       1.00     0.5142   0.1069
 [2,]       0.95     0.2122   0.0997
 [3,]       0.90     0.1890   0.0969
 [4,]       0.85     0.1714   0.0927
 [5,]       0.80     0.1600   0.0897
 [6,]       0.75     0.1471   0.0861
 [7,]       0.70     0.1362   0.0815
 [8,]       0.65     0.1268   0.0766
...          ...        ...      ...
[16,]       0.25     0.0644   0.0425
[17,]       0.20     0.0590   0.0366
[18,]       0.15     0.0551   0.0371
[19,]       0.10     0.0512   0.0309
[20,]       0.05     0.0453   0.0247
[21,]       0.00     0.0000   0.0000
Credit Risk Modeling in R

The strategy curve

Screen Shot 2020-06-22 at 6.15.30 PM.png

Credit Risk Modeling in R

Let's practice!

Credit Risk Modeling in R

Preparing Video For Download...