Input selection based on the AUC
Credit Risk Modeling in R

Lore Dirick
Manager of Data Science Curriculum at Flatiron School
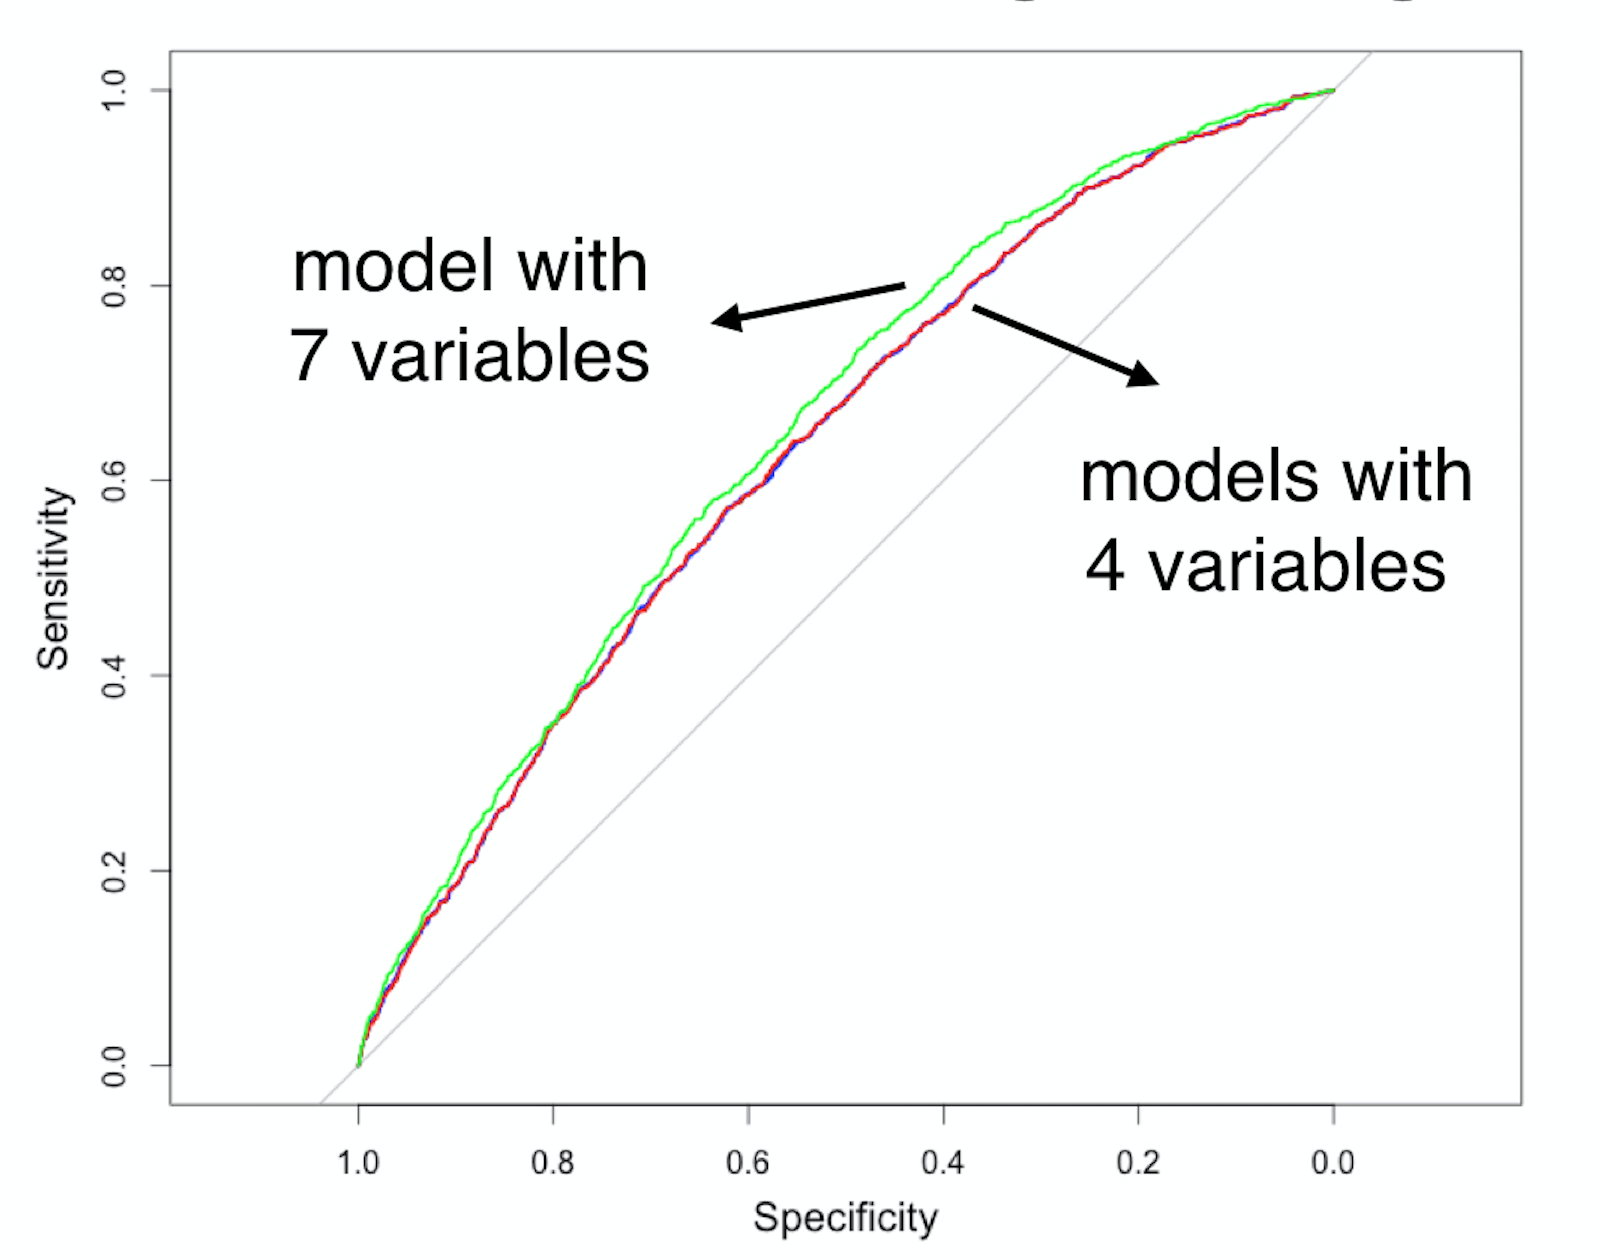
ROC curves for 4 logistic regression models
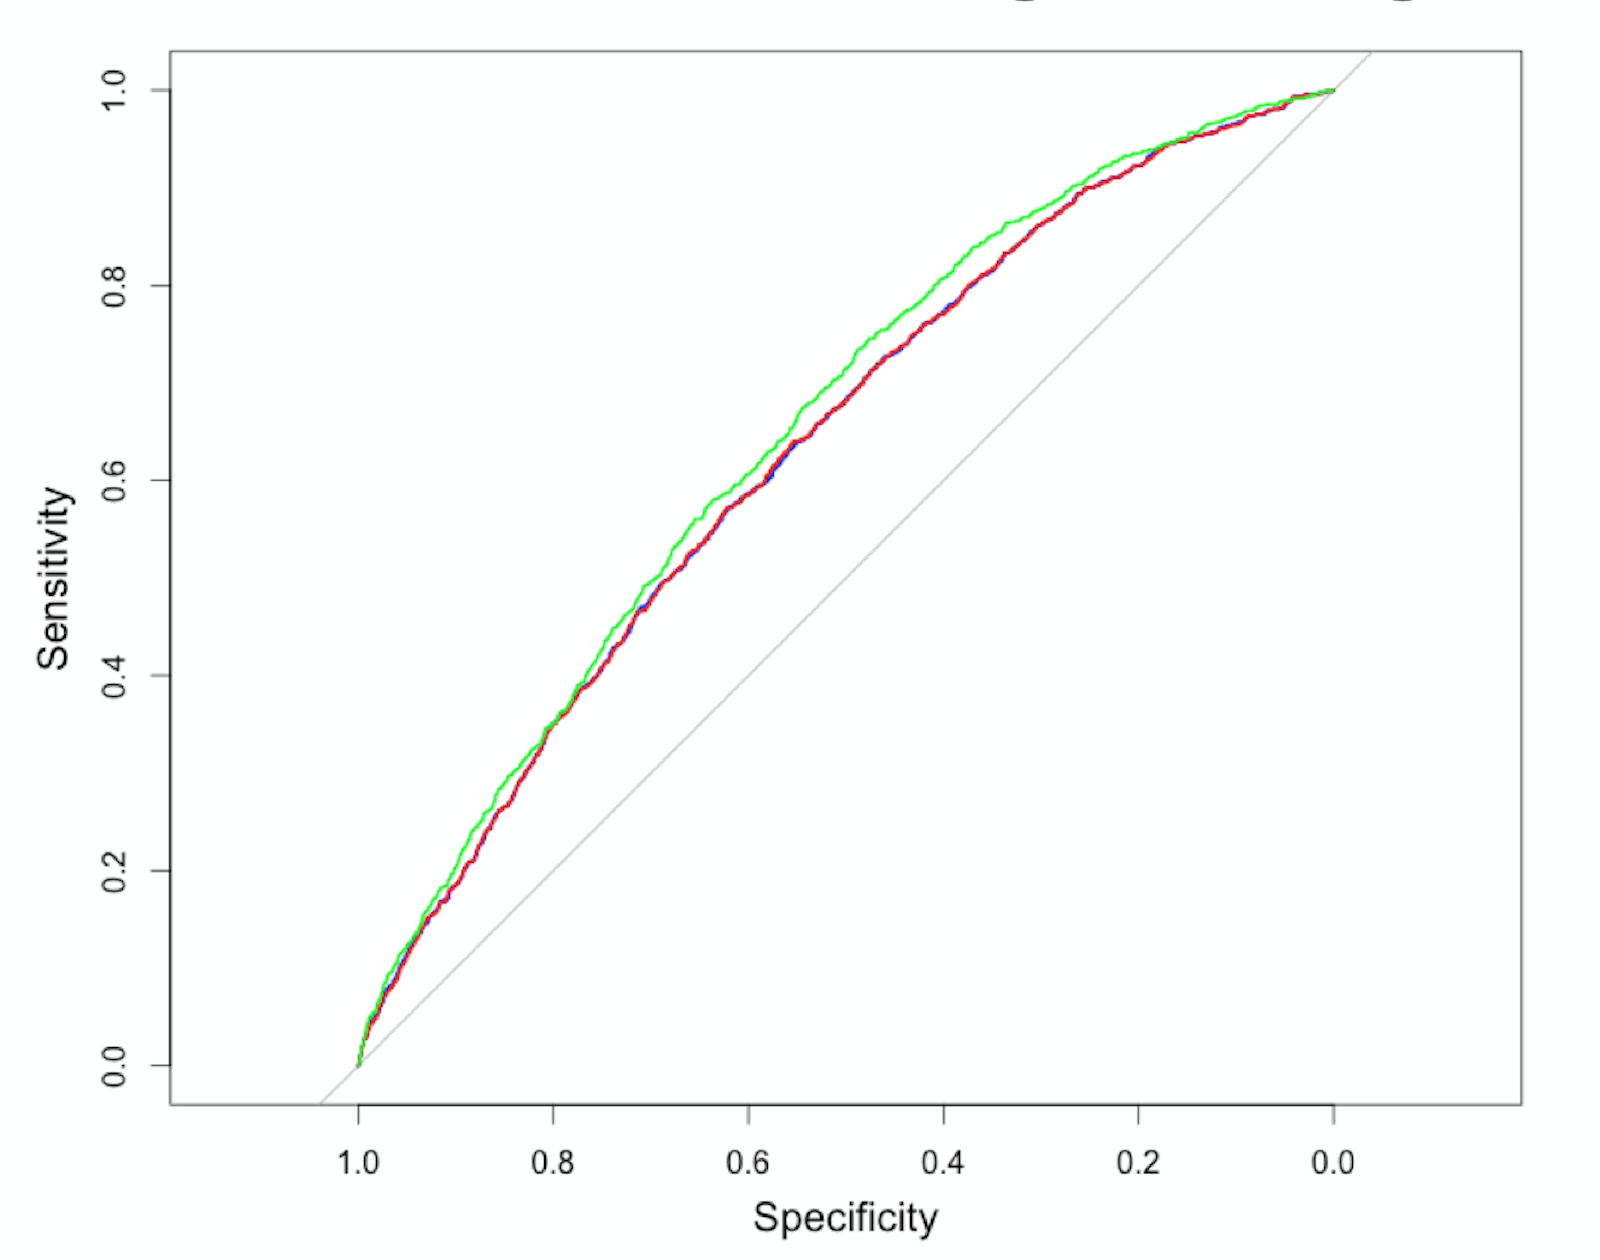
ROC curves for 4 logistic regression models
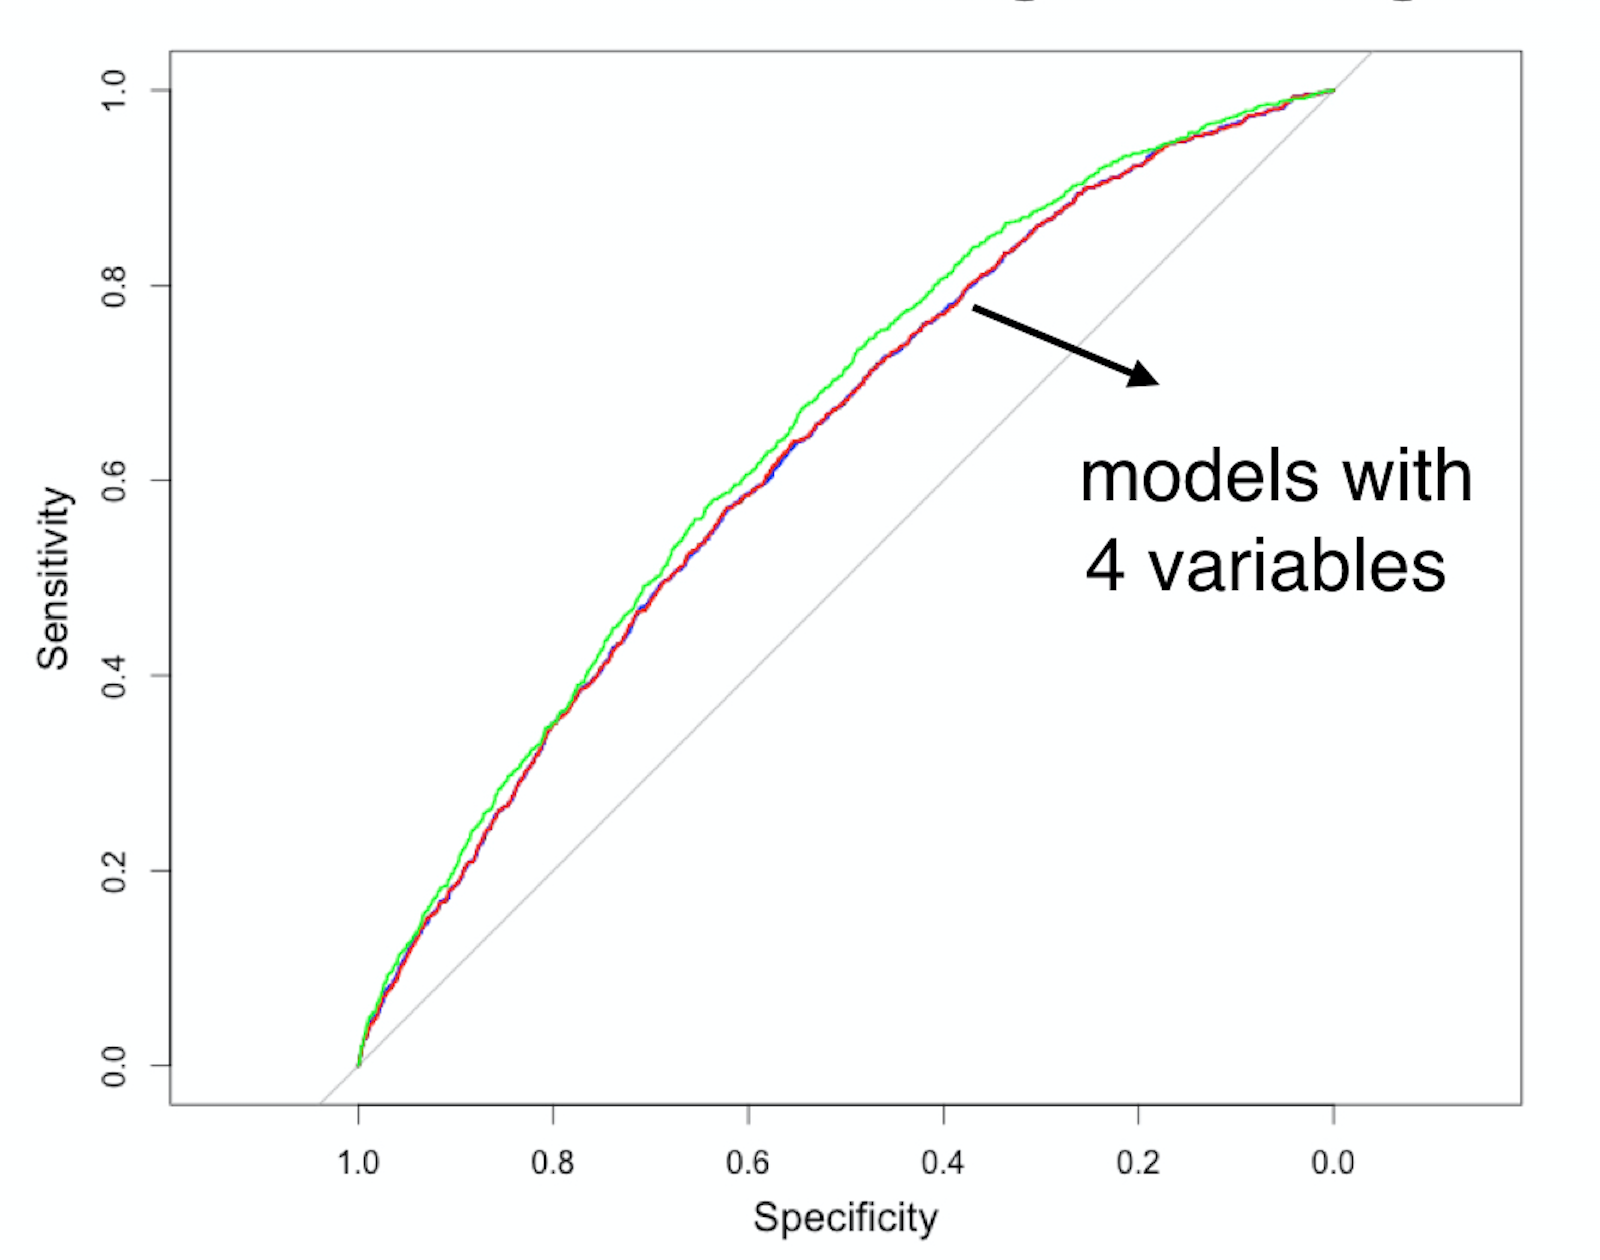
ROC curves for 4 logistic regression models