Histograms and outliers
Credit Risk Modeling in R

Lore Dirick
Manager of Data Science Curriculum at Flatiron School
Using function hist()
hist(loan_data$int_rate)
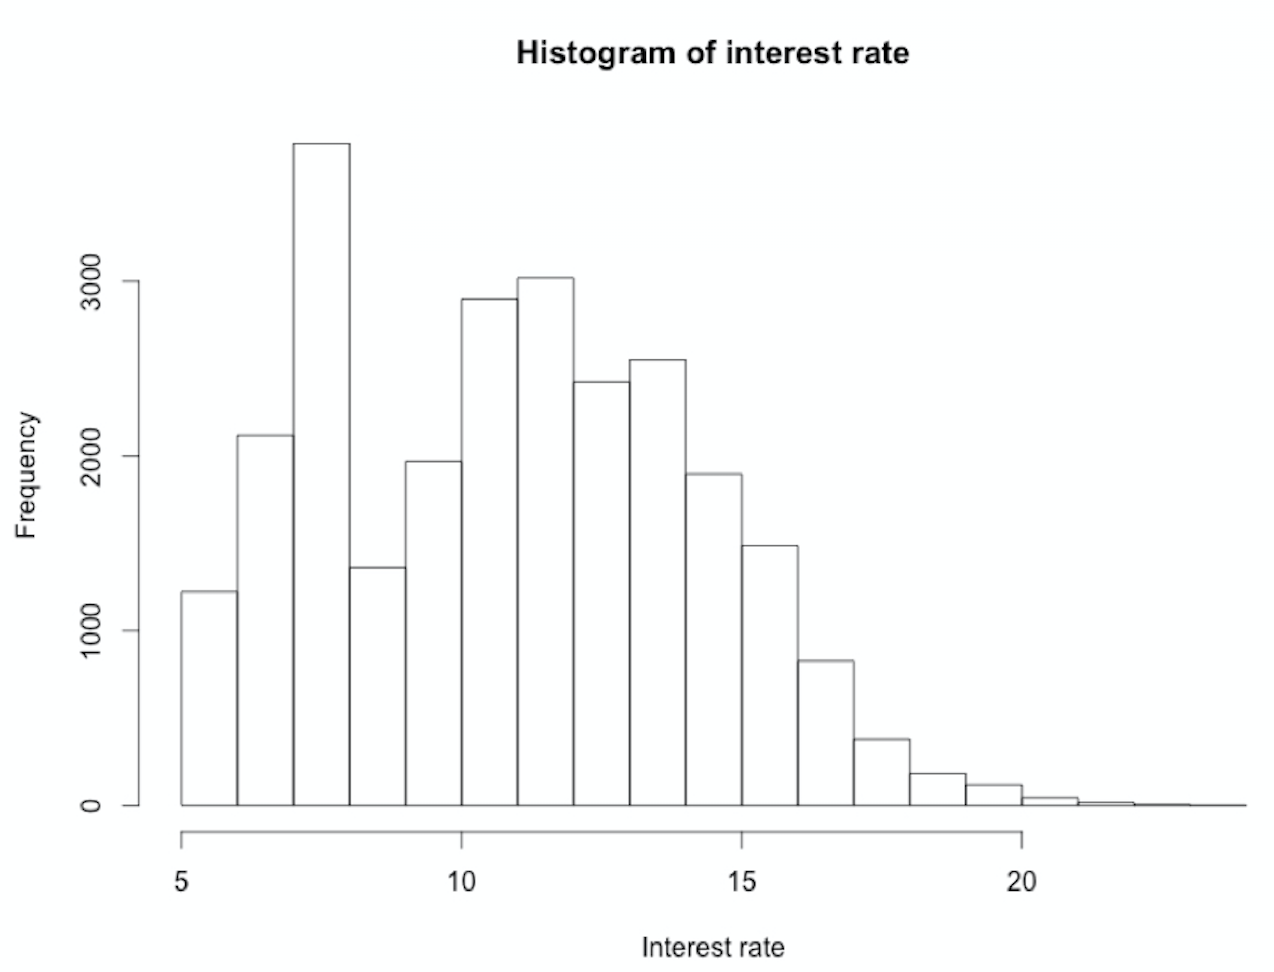
Using function hist()
hist(loan_data$int_rate, main = "Histogram of interest rate", xlab = "Interest rate")
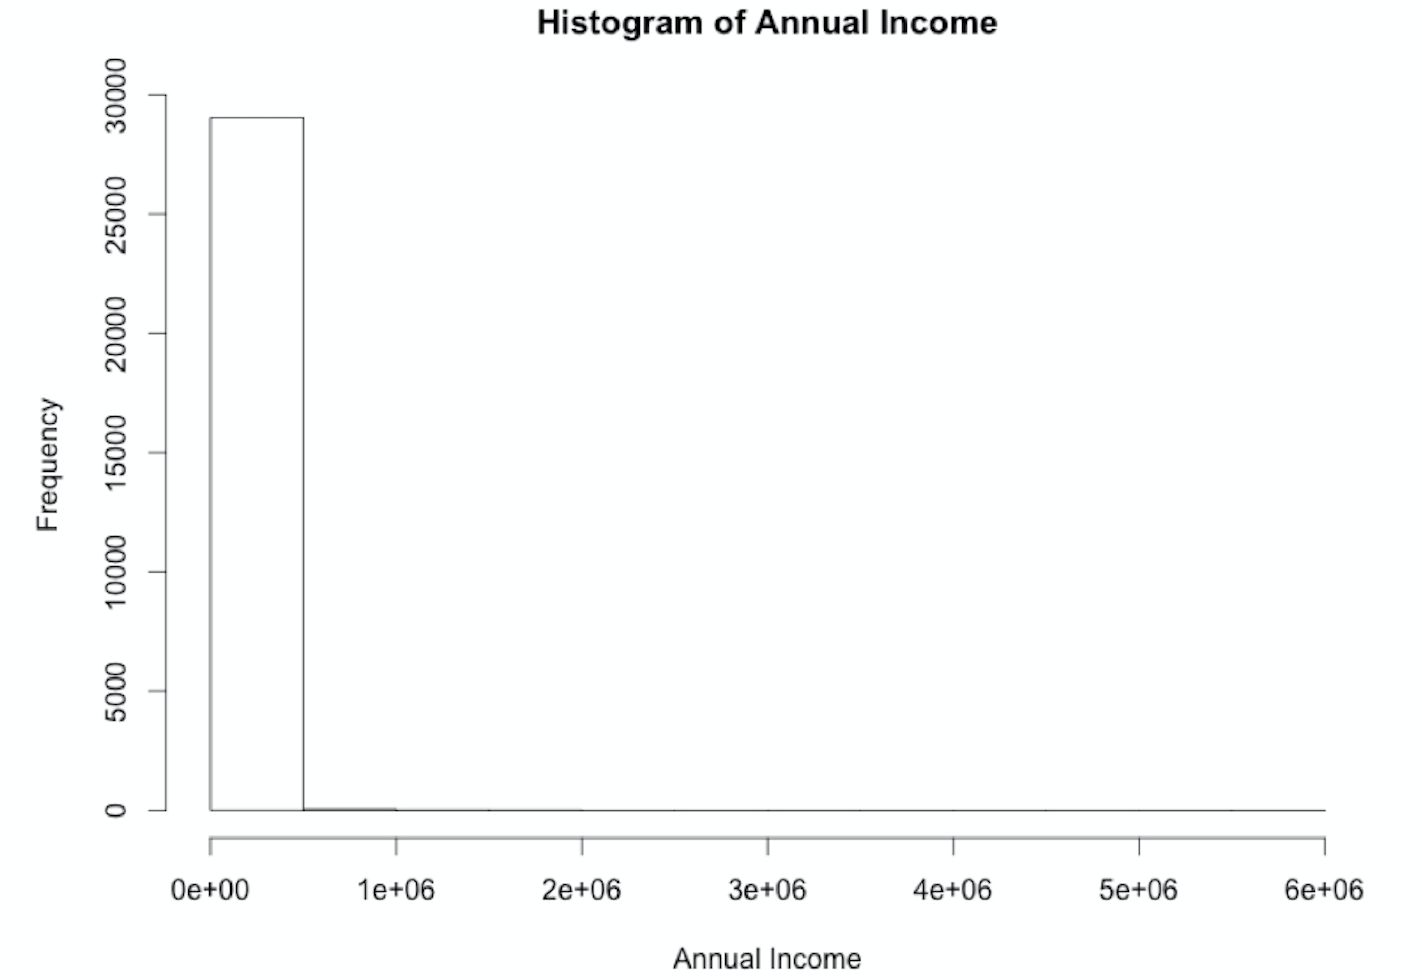
Using function hist() on annual_inc
hist(loan_data$annual_inc, xlab = "Annual Income", main = "Histogram of Annual Income")
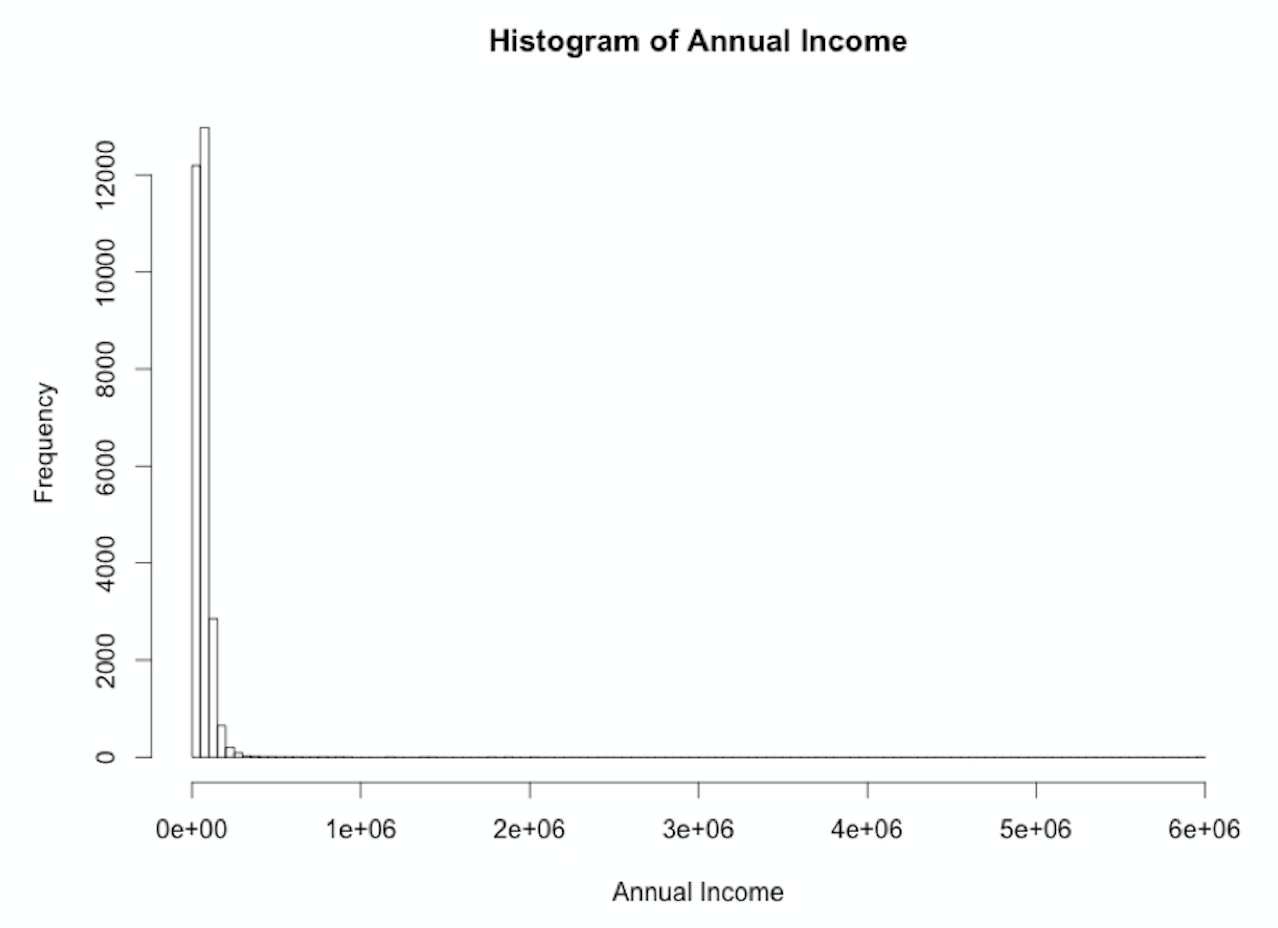
The breaks-argument
n_breaks <- sqrt(nrow(loan_data)) # n_breaks = 170.5638
hist_income_n <- hist(loan_data$annual_inc, breaks = n_breaks,
                      xlab = "Annual Income", main = "Histogram of Annual Income")
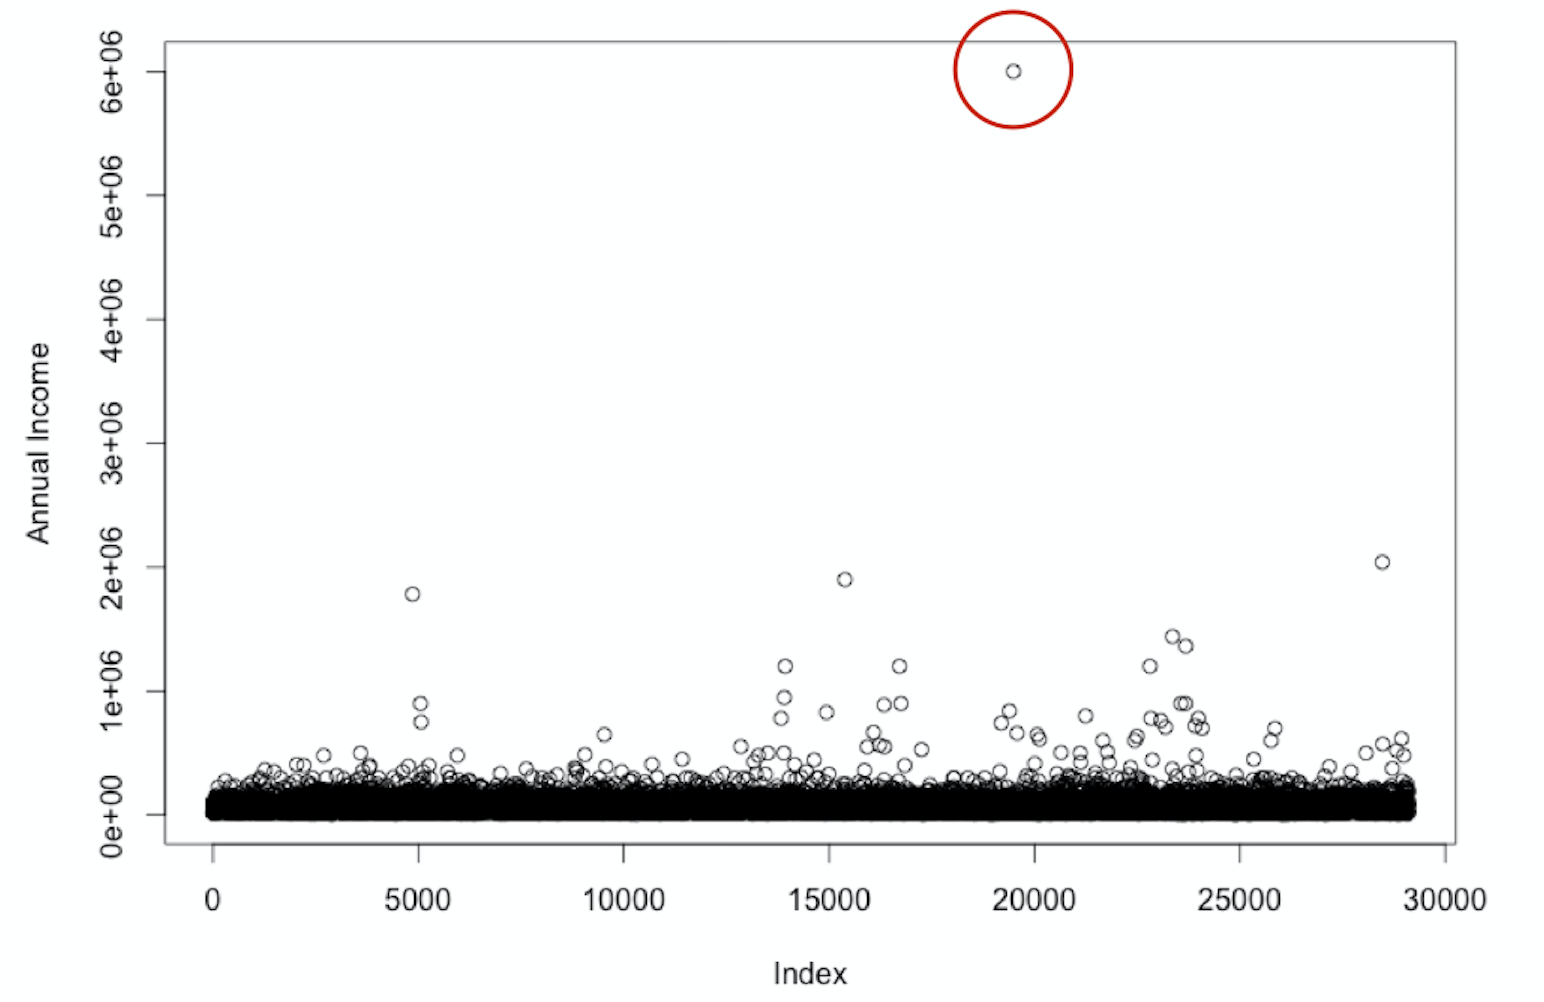
annual_inc
plot(loan_data$annual_inc, ylab = "Annual Income")
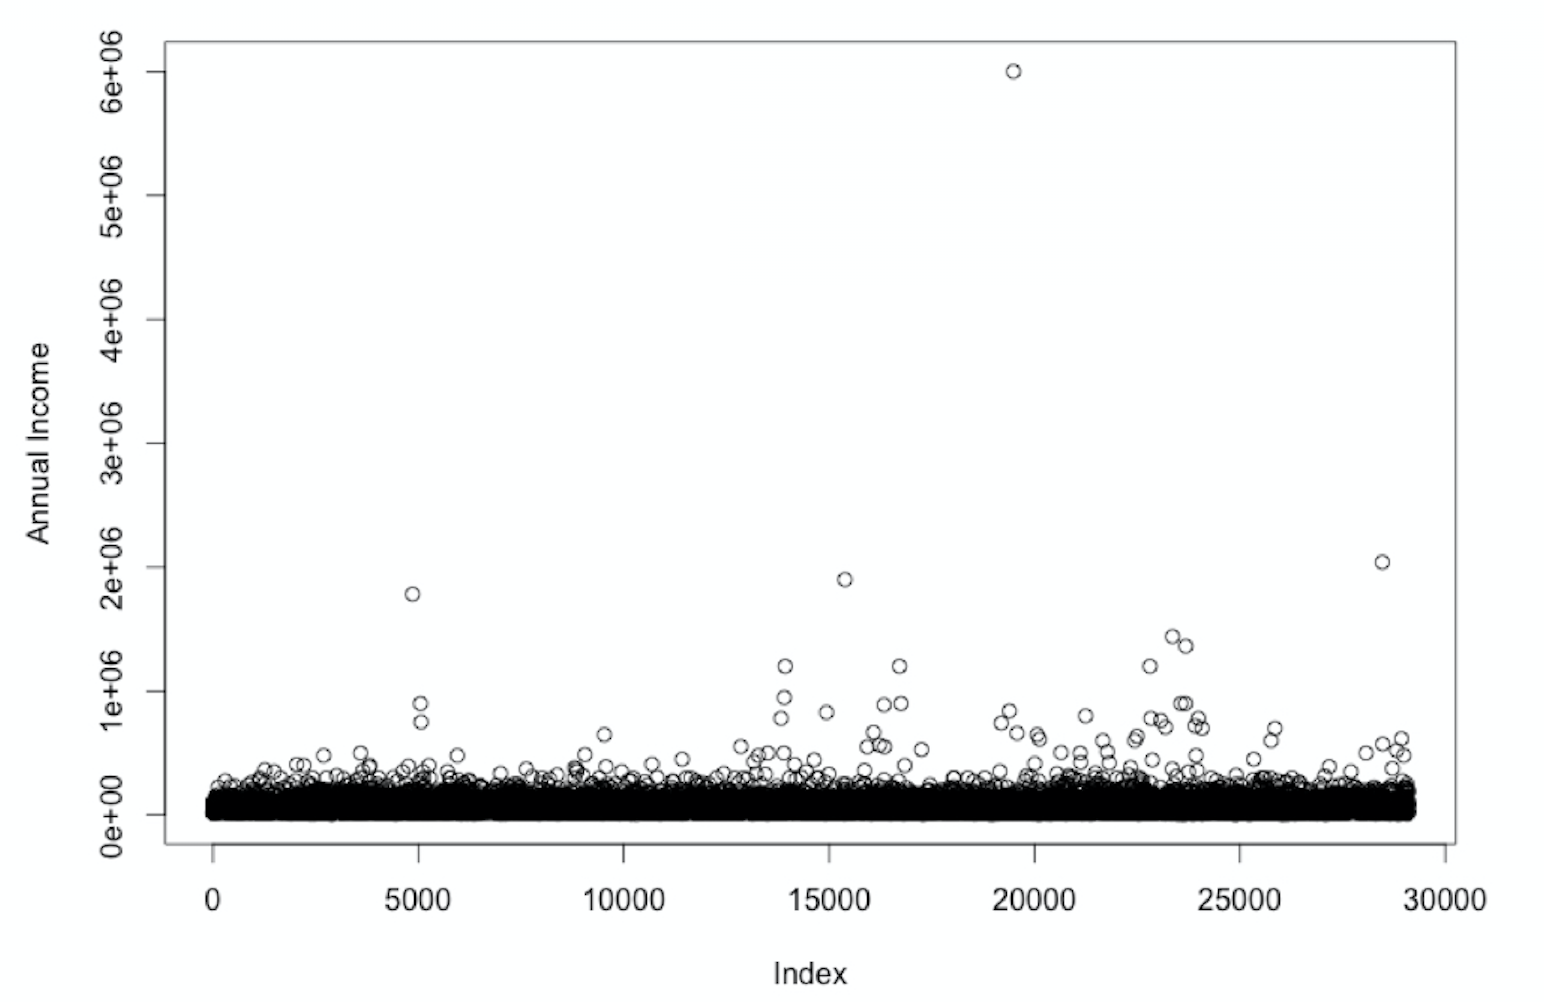
annual_inc
plot(loan_data$annual_inc, ylab = "Annual Income")
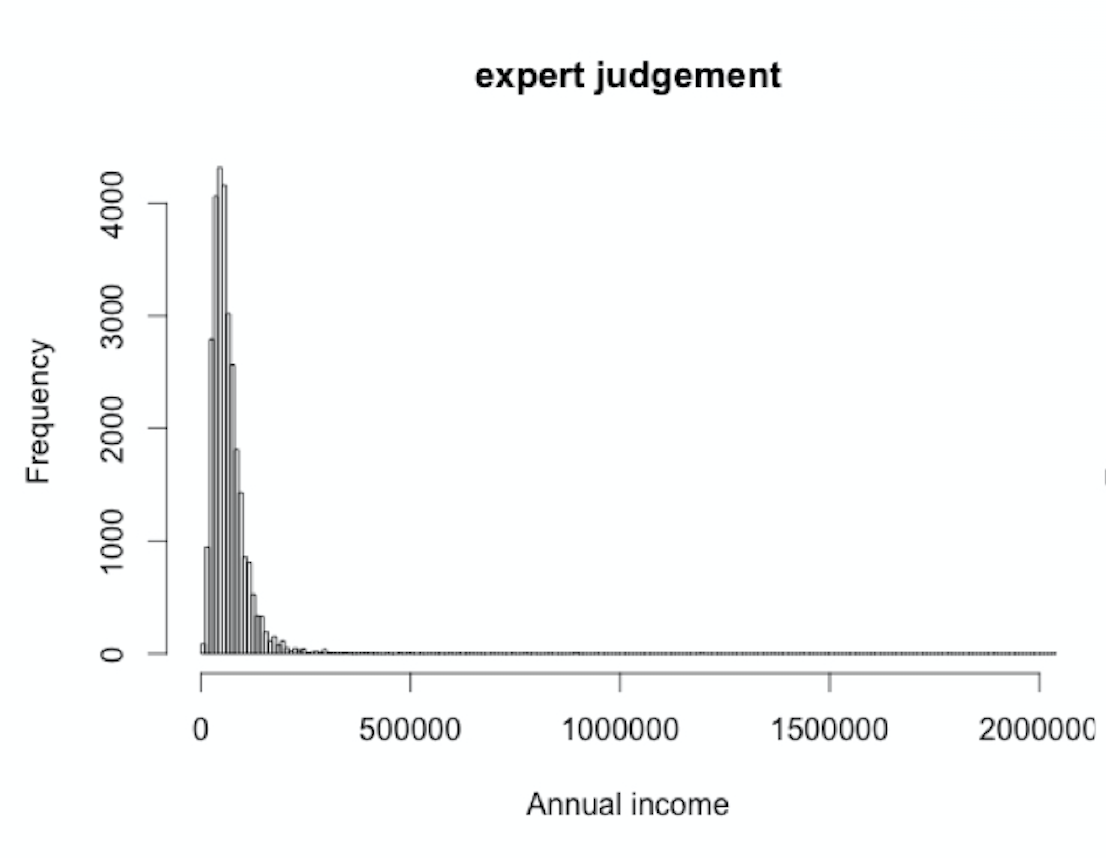
hist(loan_data_expert$annual_inc,
     sqrt(nrow(loan_data_expert)),
     xlab = "Annual income")
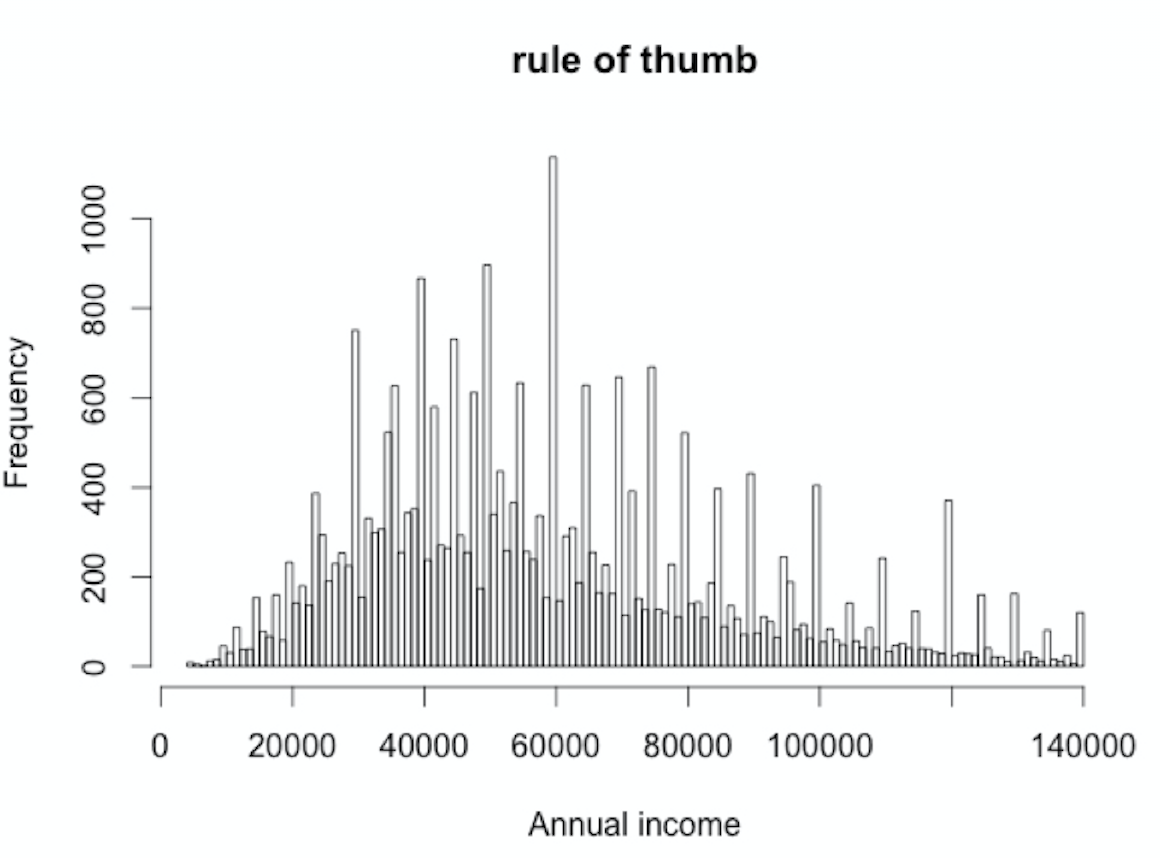
hist(loan_data_ROT$annual_inc,
     sqrt(nrow(loan_data_ROT)),
     xlab = "Annual income")
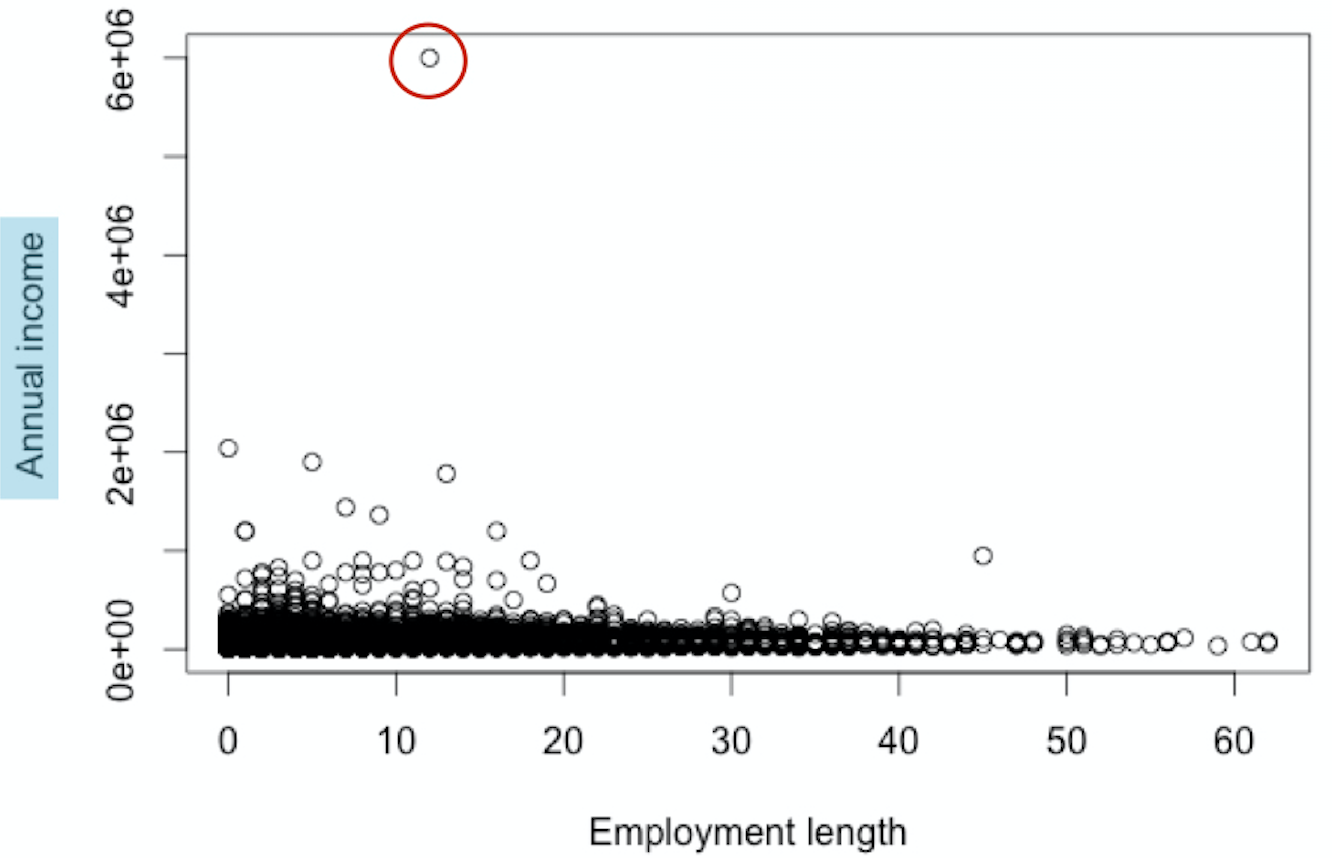
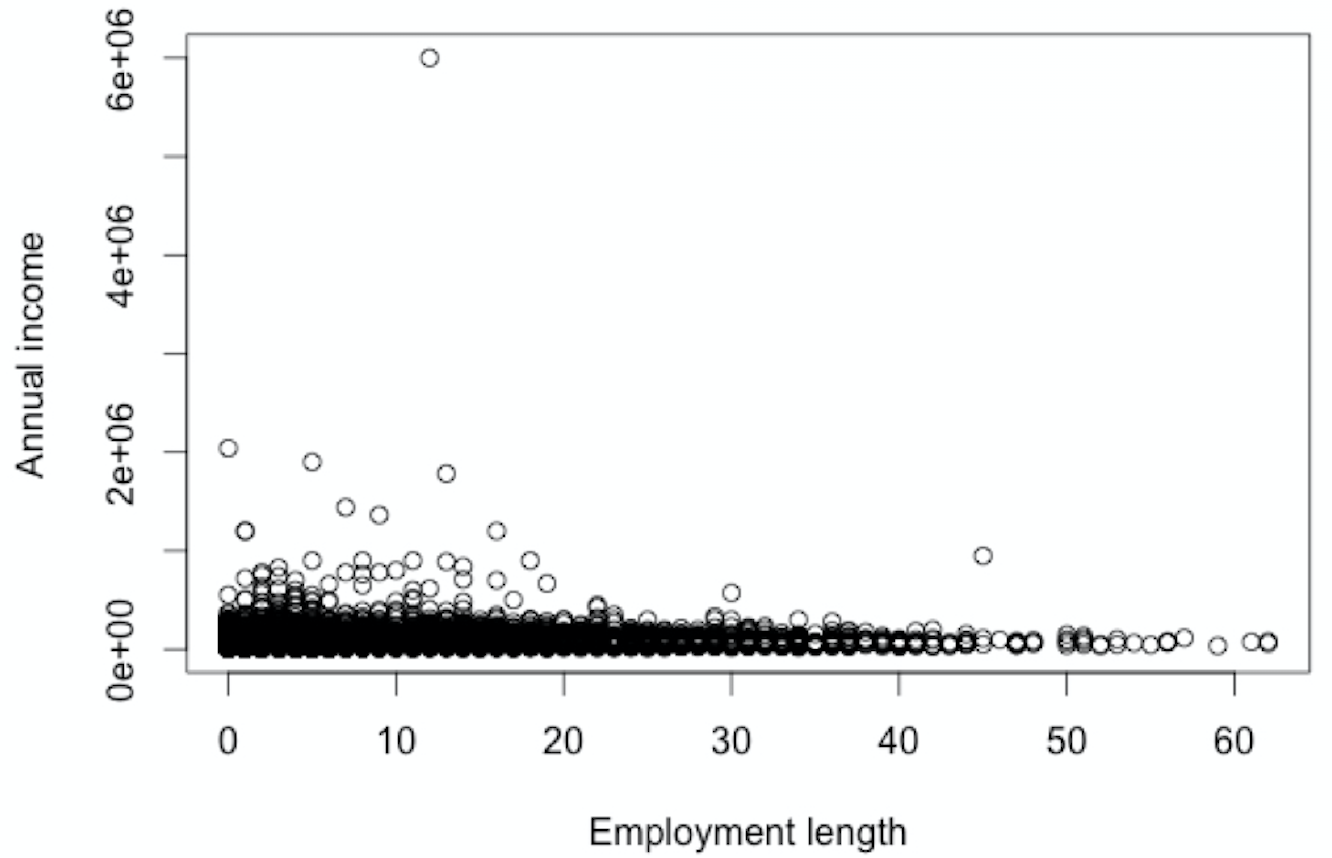
Bivariate plot
plot(loan_data$emp_length, loan_data$annual_inc,
     xlab= "Employment length", ylab= "Annual income")
Bivariate plot
plot(loan_data$emp_length, loan_data$annual_inc,
     xlab= "Employment length", ylab= "Annual income")