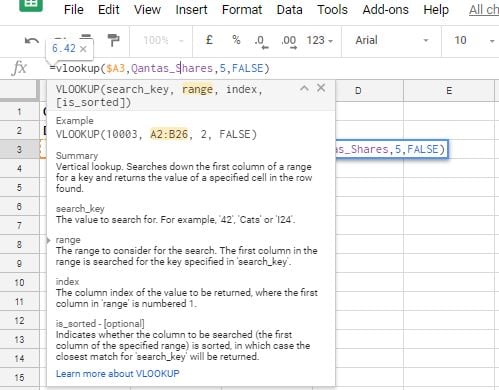
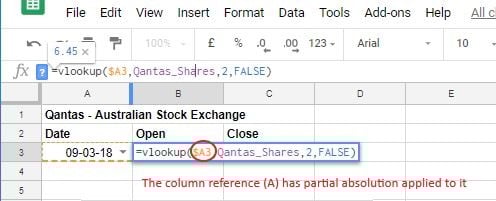
Using VLOOKUP with data validation

Data Visualization in Google Sheets

Raina Hawley

Owner/Instructor of OzGrid Business Applications

VLOOKUP

  • Vertical lookup
  • Retrieve data from tables
  • Find an exact match, or closest possible match, in a list
  • Uses dates selected through data validation and look up data from main dataset
Data Visualization in Google Sheets

Adding the VLOOKUP

Data Visualization in Google Sheets

VLOOKUP arguments

  • search_key
    • Value to look for in the first column of a table
  • range
    • Table to retrieve a value from
  • index
    • Column in the table to retrieve value from
  • [is_sorted]
    • Optional argument
    • FALSE = exact match
    • TRUE = closest possible match
Data Visualization in Google Sheets

Partial absolution

  • Absolution denoted by $
  • $A3
    • Always referring to column A
    • Row reference will change as you copy it
    • "Locking" column A
Data Visualization in Google Sheets

Copying your formula

Data Visualization in Google Sheets

Pasting the formula


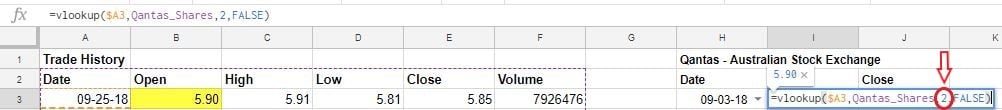
  • Changing the column reference number
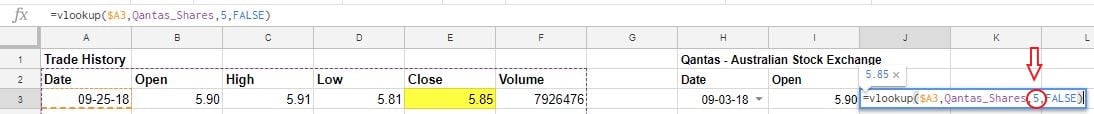
    • To show Close figure in column 5, change from 2 to 5
    • To show the Volume figure in column 6, change from 2 to 6
Data Visualization in Google Sheets

Creating the line plot

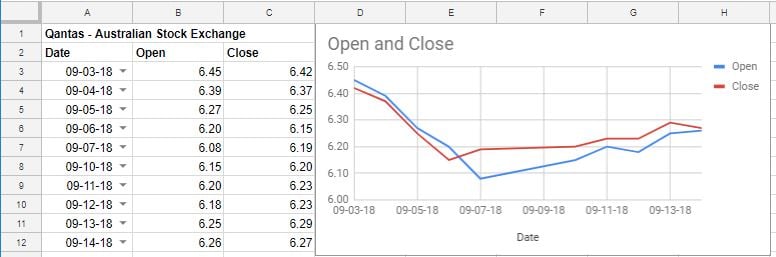
  • Use data validation and VLOOKUP to show only relevant values in your data
  • Create a line chart
    • Highlight the range you want to plot, including headings
    • Click Insert chart icon, select line chart
Data Visualization in Google Sheets

Have a go!

Data Visualization in Google Sheets

Preparing Video For Download...