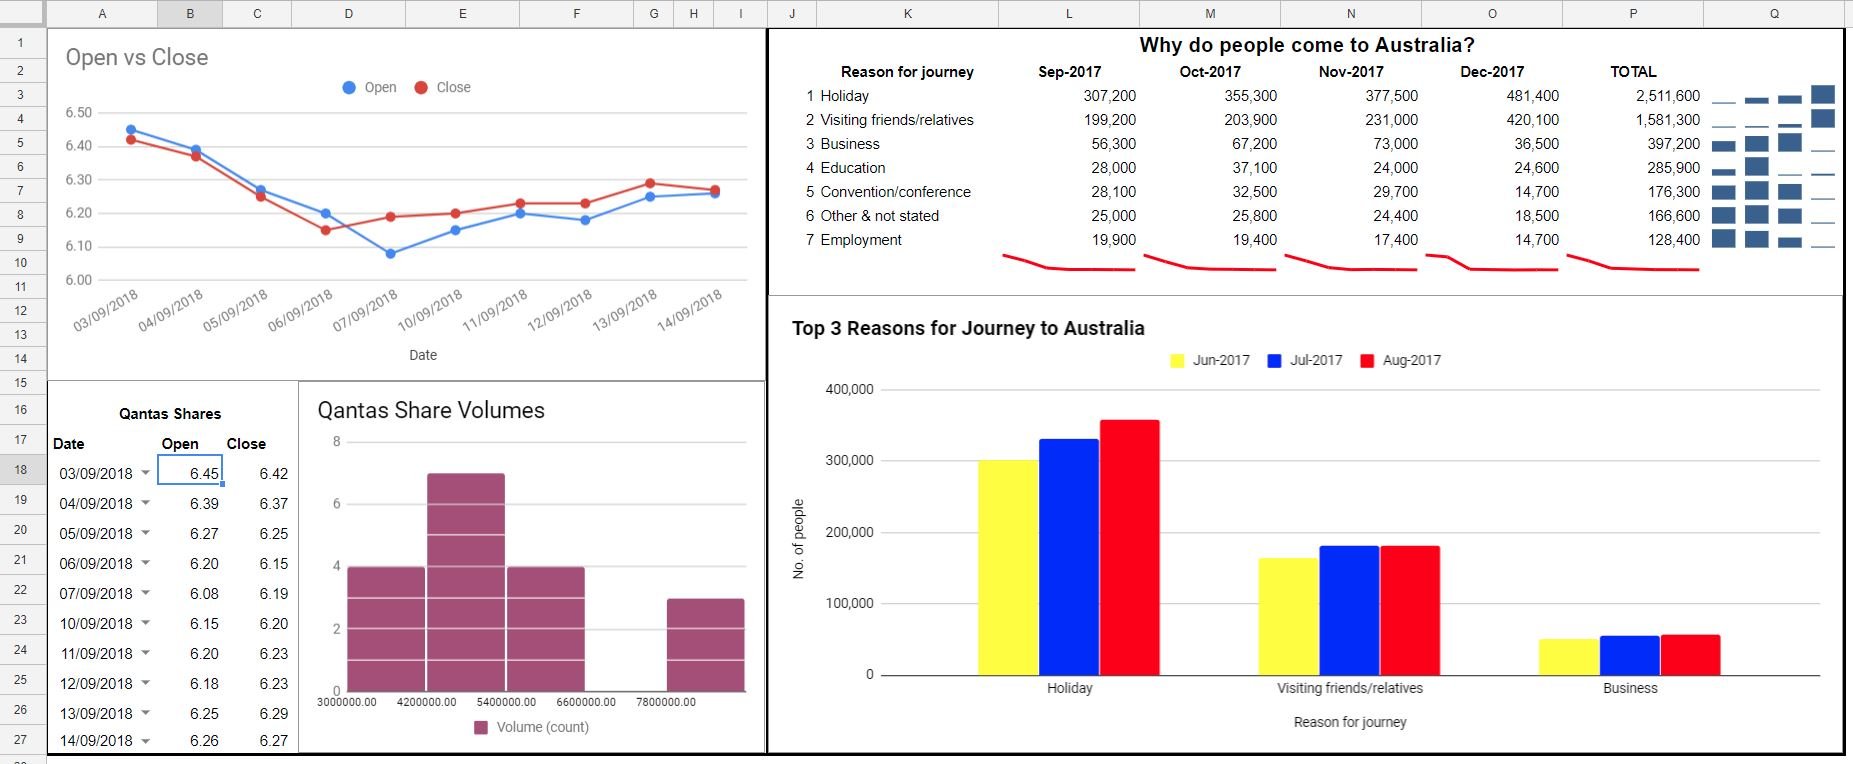
Formulas and tidying up the dashboard
Data Visualization in Google Sheets
Raina Hawley
Owner/Instructor - OzGrid Business Applications
Some common uses for formulas
- Highlight a row that meets a certain condition, rather than a cell
- Comparing lists and values
- Highlight duplicates and discrepancies
- Highlight specific number or text entry
- Highlight alternate rows
- Enable the use of a dynamic named range
- Find errors and blanks
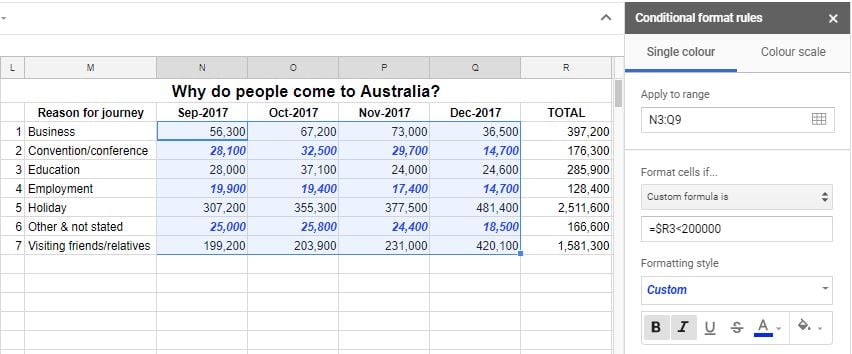
Highlight a row using a formula
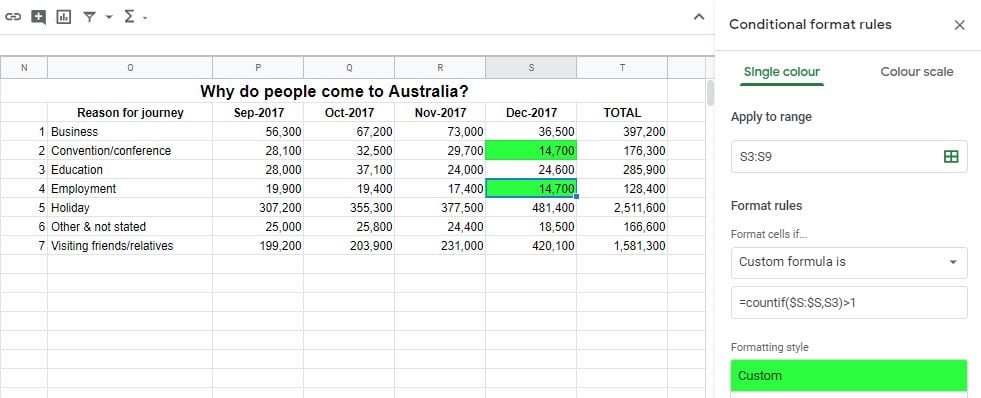
Highlight duplicates
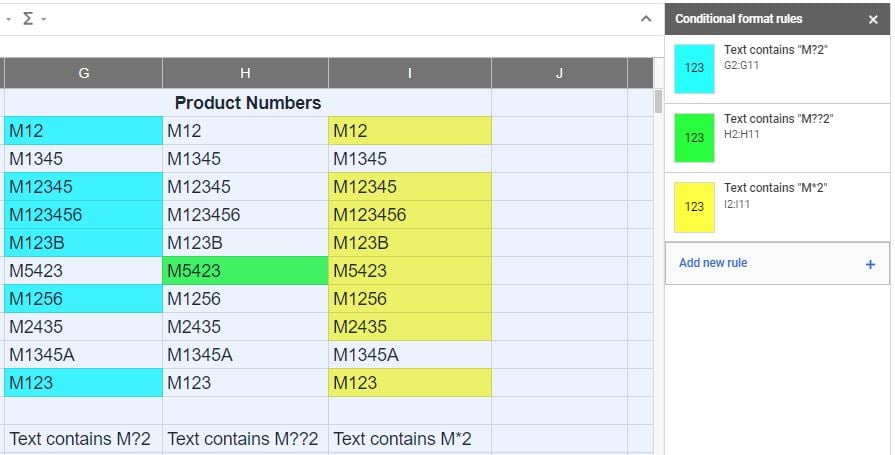
Wildcard characters
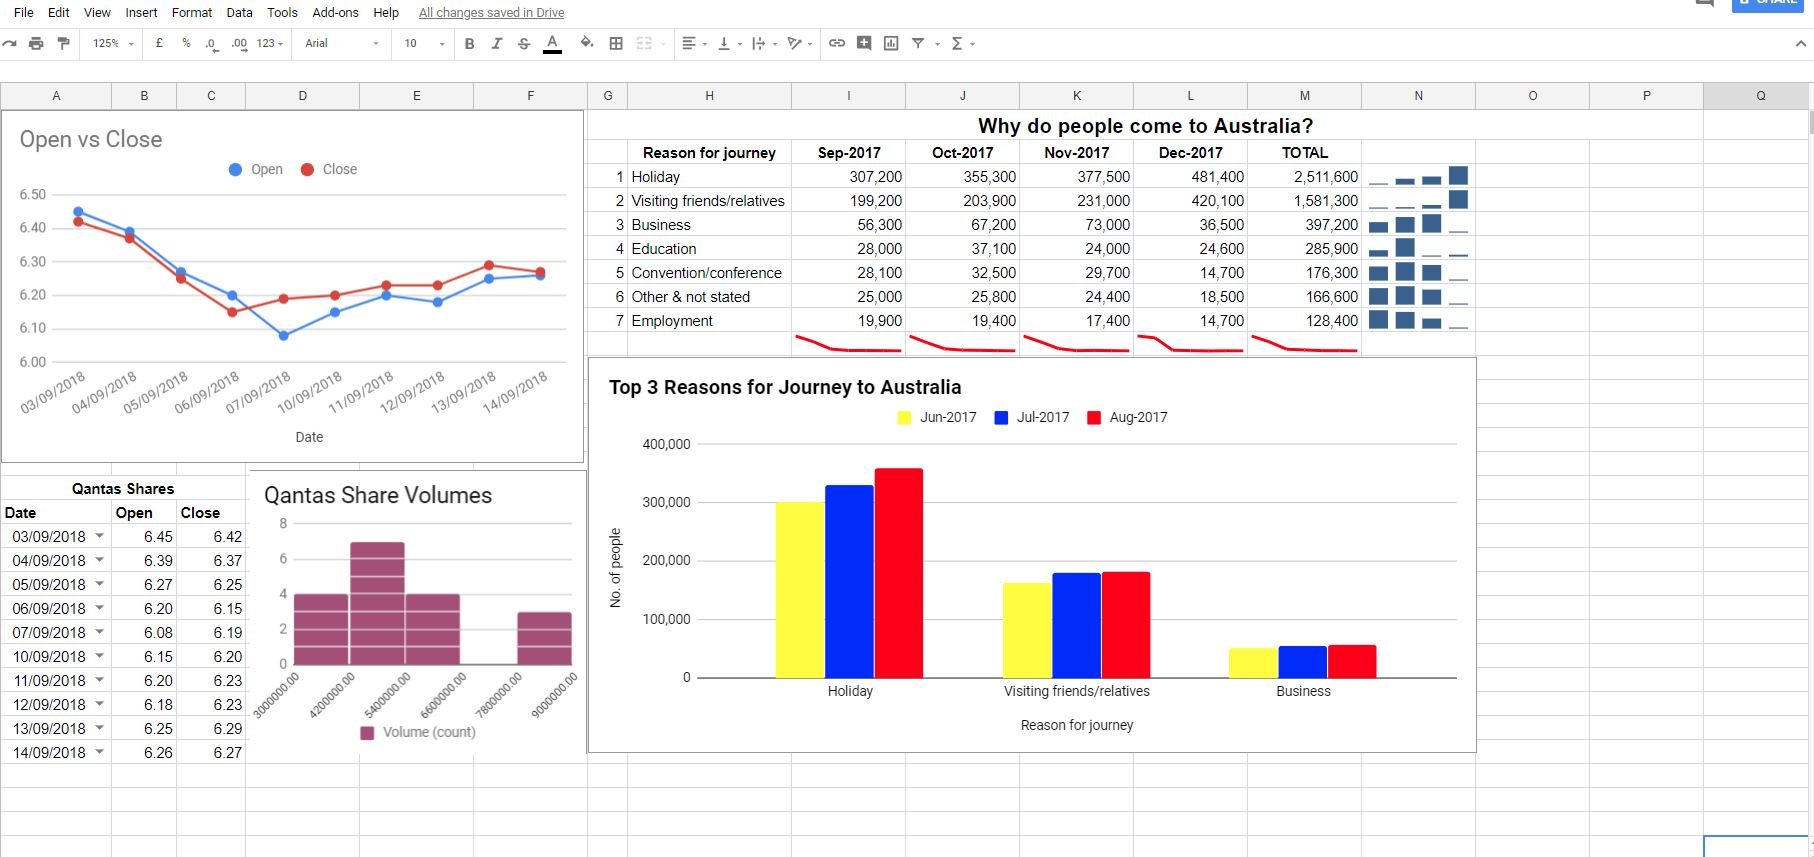
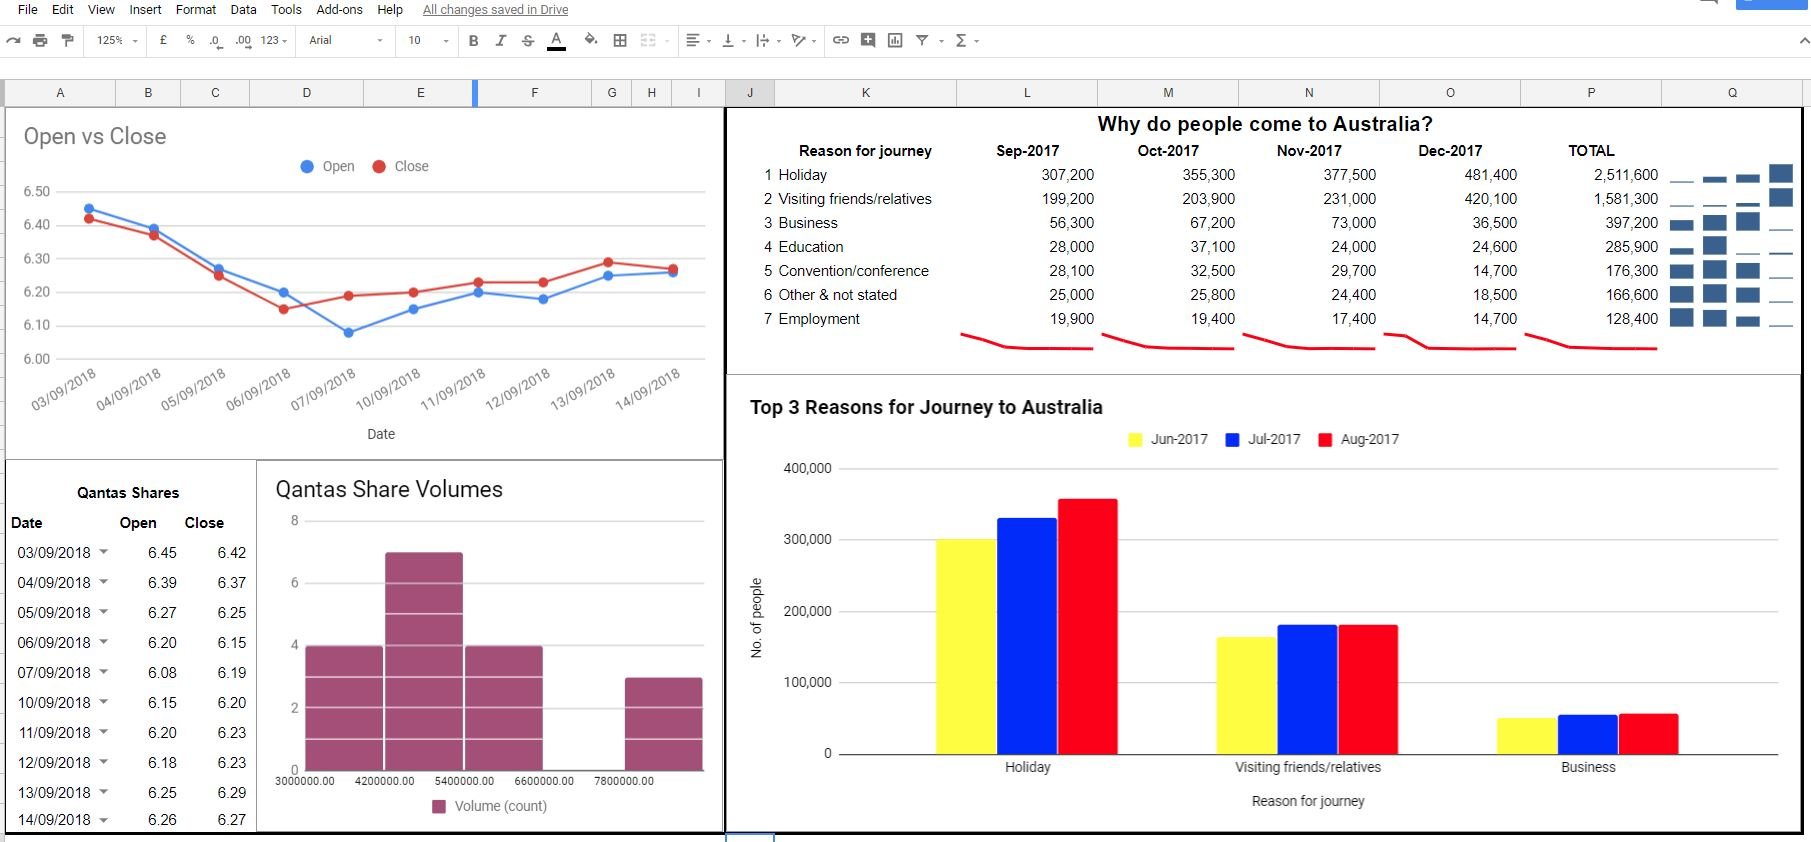
Tidying up the dashboard
What else should you do?
Hiding the toolbars
Practice time!
Data Visualization in Google Sheets
