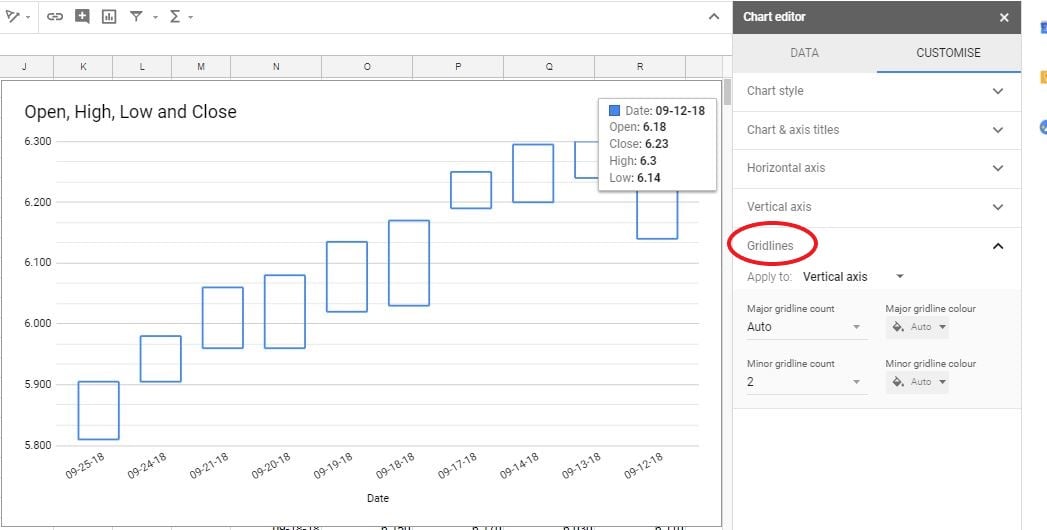
Candlestick charts
Data Visualization in Google Sheets
Raina Hawley
Owner/Instructor - OzGrid Business Applications
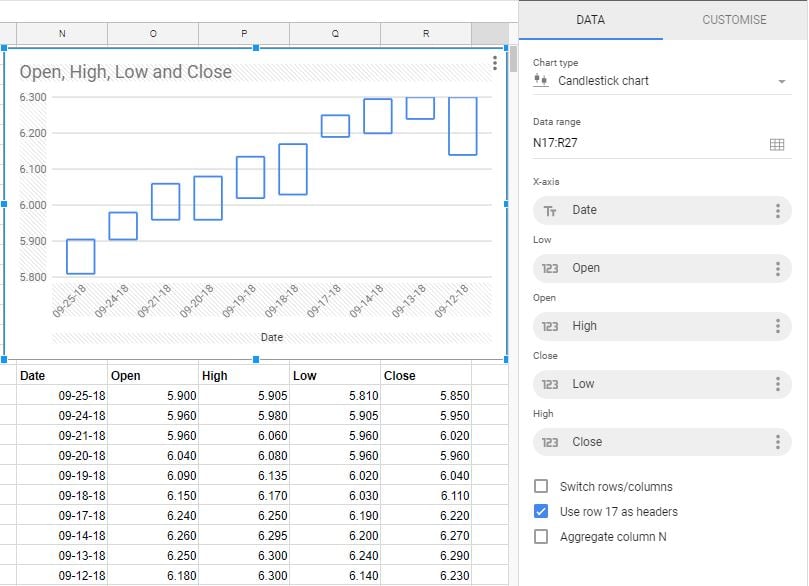
Creating a candlestick
Display price information
Show trends
Predict future behavior
Display day to day market movement
Optimize your dataset first
Named ranges
Validations
VLOOKUPs
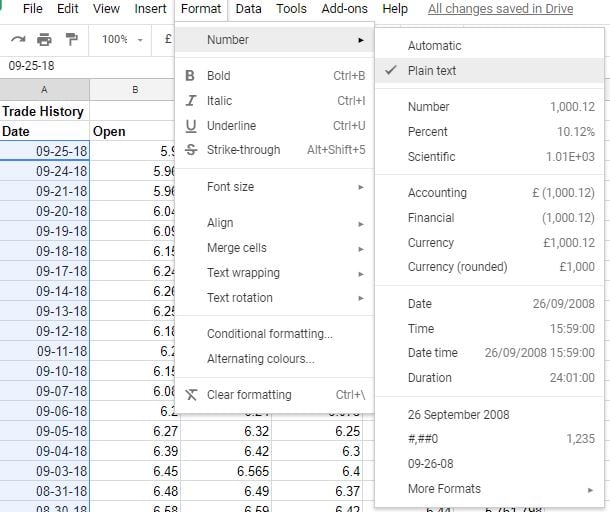
Formatting dates as plain text
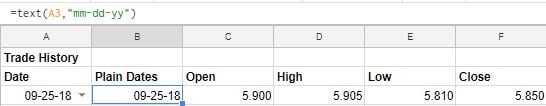
Plain text using a formula
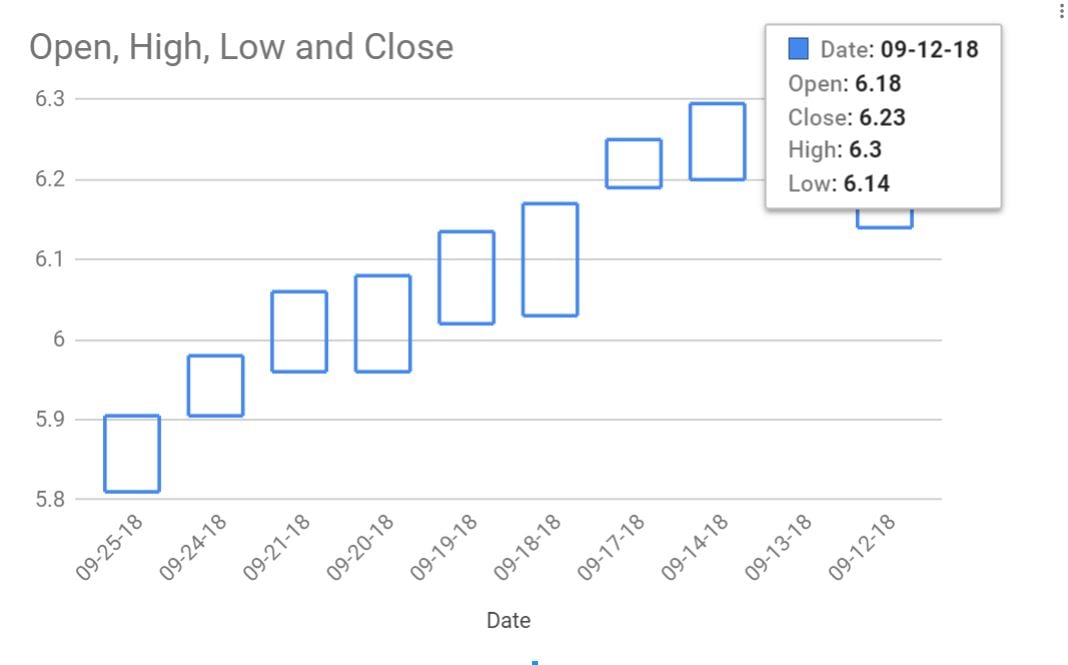
Viewing the detail
Formatting your candlestick chart
Let's do it!
Data Visualization in Google Sheets
Preparing Video For Download...