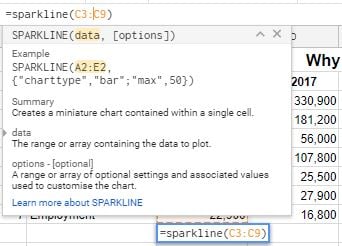
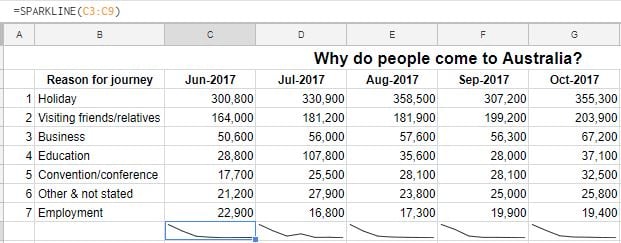
Creating the sparkline
Sparklines in your dashboard
- Give a quick snapshot
- Work better in a single cell
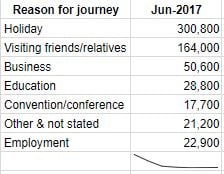
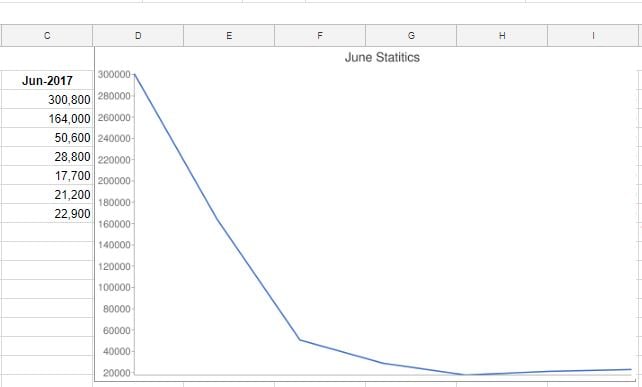
Line sparklines
Line chart within a cell
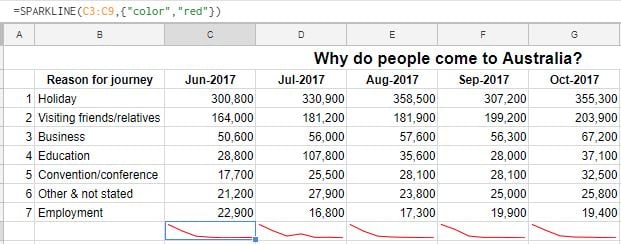
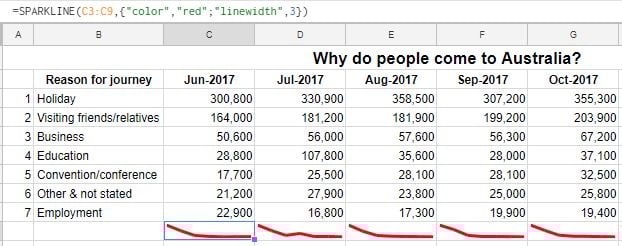
Changing color
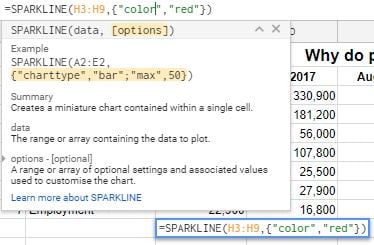
Red sparklines
Color and line width
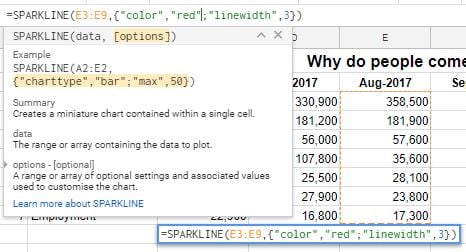
Changing the width of your sparkline
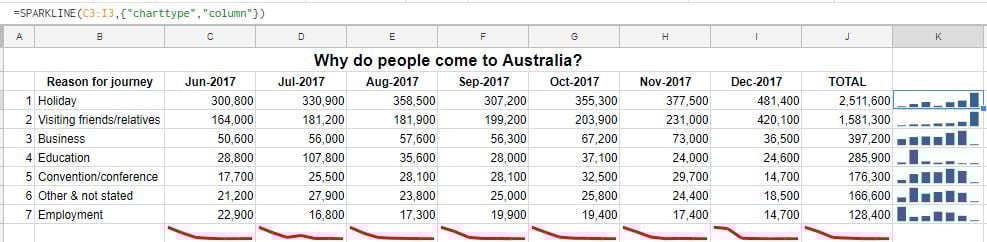
Column sparklines
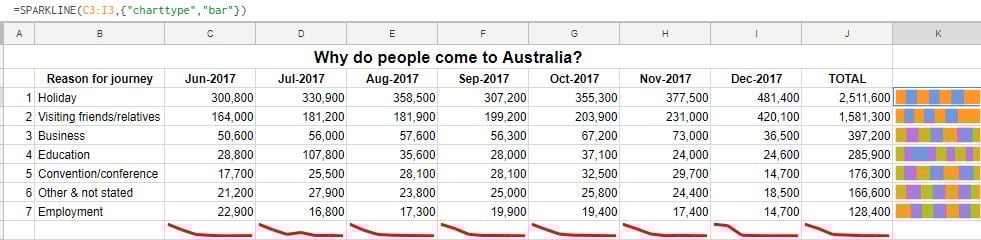
Bar sparklines
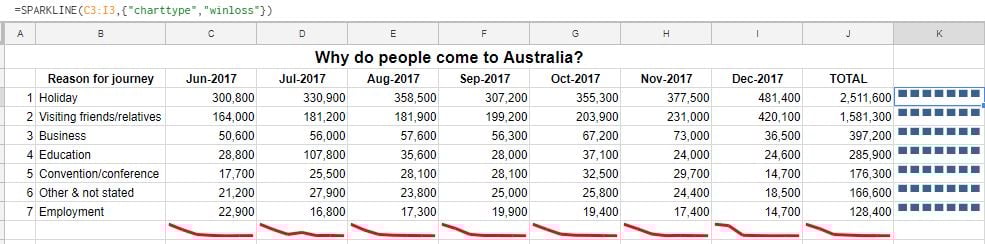
Winloss sparklines