Data Scientist at DataRobot and co-author of caret
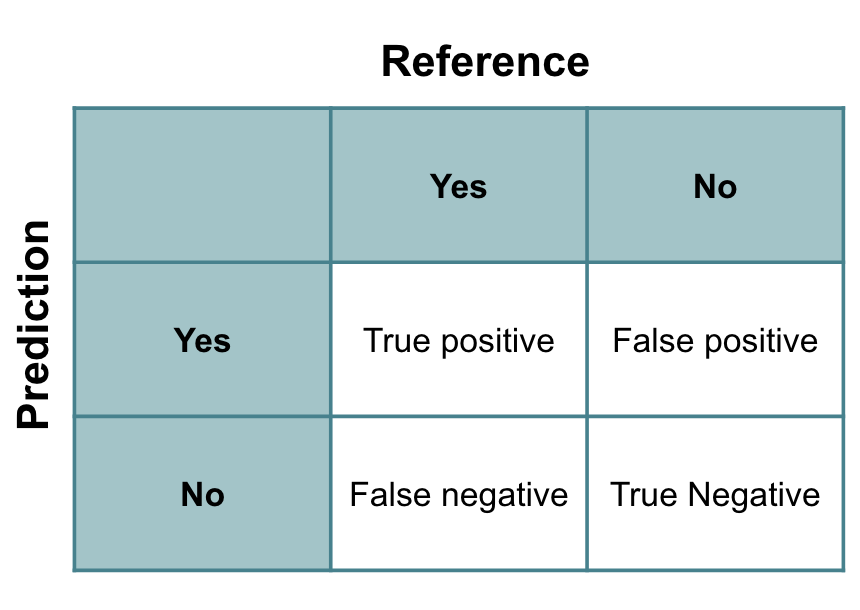
Confusion matrix
Confusion matrix
# Fit a model
model <- glm(Class ~ ., family = binomial(link = "logit"), train)
p <- predict(model, test, type = "response")
summary(p)
   Min. 1st Qu.  Median    Mean 3rd Qu.    Max.
 0.0000  0.0000  0.9885  0.5296  1.0000  1.0000
# Turn probabilities into classes and look at their frequencies
p_class <- ifelse(p > 0.50, "M", "R")
table(p_class)
p_class
 M  R
44 39
Confusion matrix
Make a 2-way frequency table
Compare predicted vs. actual classes
# Make simple 2-way frequency table
table(p_class, test[["Class"]])
p_class  M  R
      M 13 31
      R 30  9
Confusion matrix
# Use caret’s helper function to calculate additional statistics
confusionMatrix(p_class, test[["Class"]])
         Reference
Prediction  M  R
         M 13 31
         R 30  9

               Accuracy : 0.2651
                 95% CI : (0.1742, 0.3734)
    No Information Rate : 0.5181
    P-Value [Acc > NIR] : 1

                  Kappa : -0.4731
 Mcnemar's Test P-Value : 1

            Sensitivity : 0.3023
            Specificity : 0.2250
         Pos Pred Value : 0.2955
         Neg Pred Value : 0.2308