Profile and interpret segments
Customer Segmentation in Python

Karolis Urbonas
Head of Data Science, Amazon
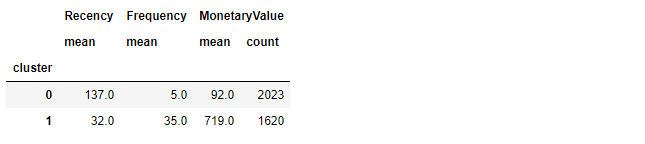
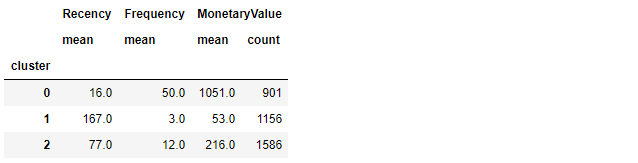
Summary statistics of each cluster
- Compare average RFM values of each clustering solution
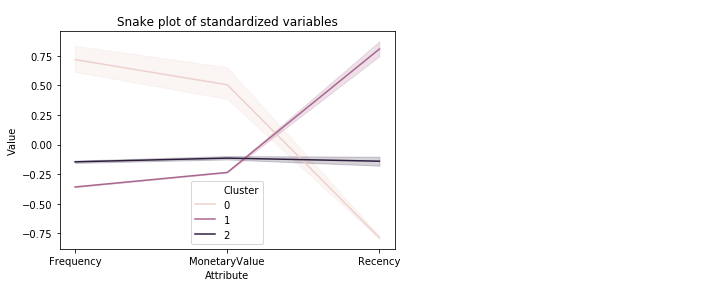
Visualize a snake plot
plt.title('Snake plot of standardized variables')
sns.lineplot(x="Attribute", y="Value", hue='Cluster', data=datamart_melt)
Relative importance heatmap
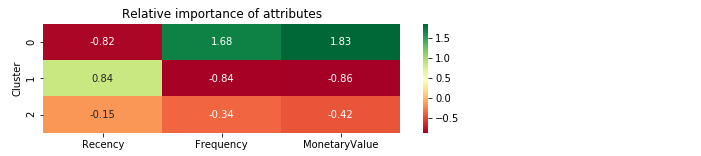
         Recency  Frequency  MonetaryValue
Cluster
0          -0.82       1.68           1.83
1           0.84      -0.84          -0.86
2          -0.15      -0.34          -0.42

