Managing skewed variables
Customer Segmentation in Python

Karolis Urbonas
Head of Data Science, Amazon
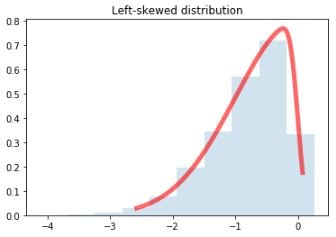
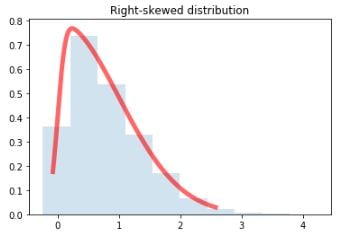
Identifying skewness
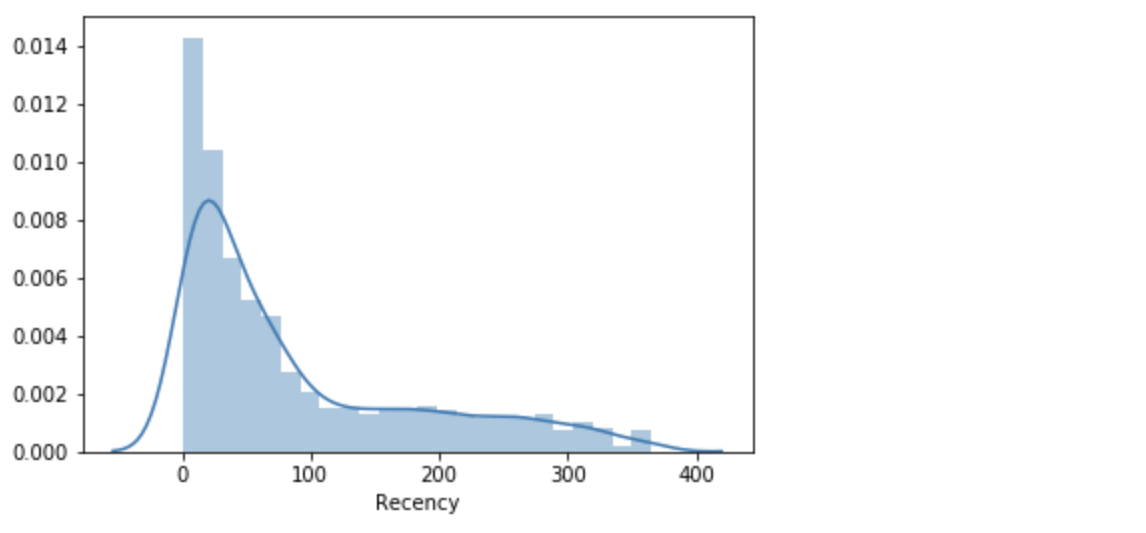
Exploring distribution of recency
sns.distplot(datamart['Recency'])
plt.show()
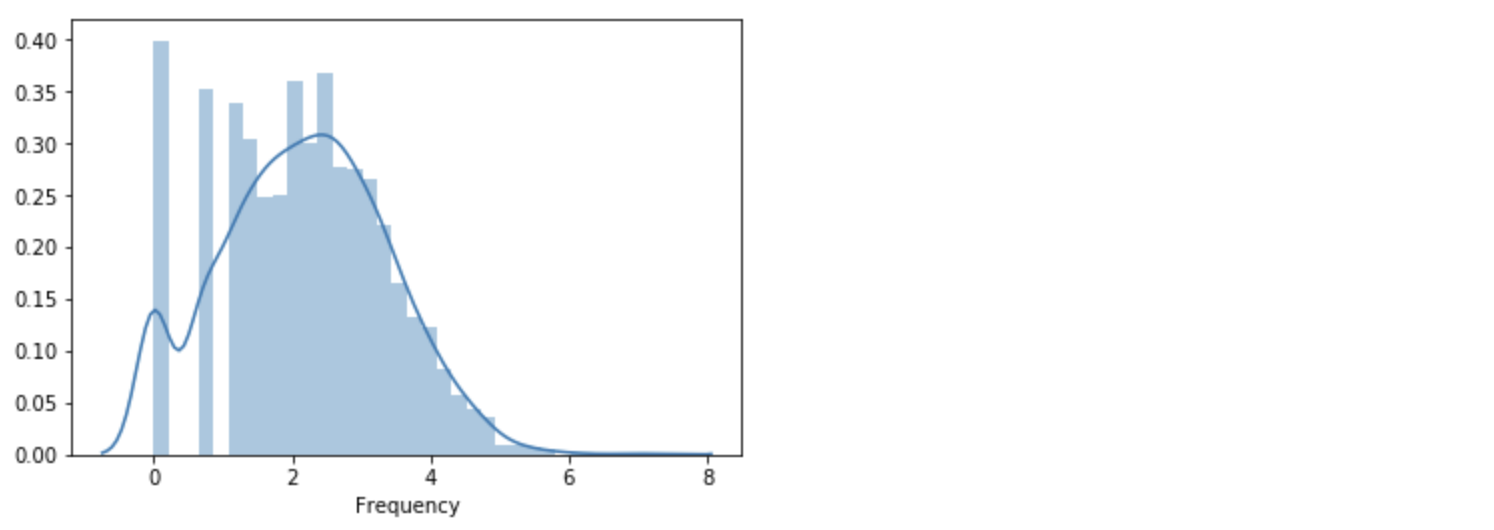
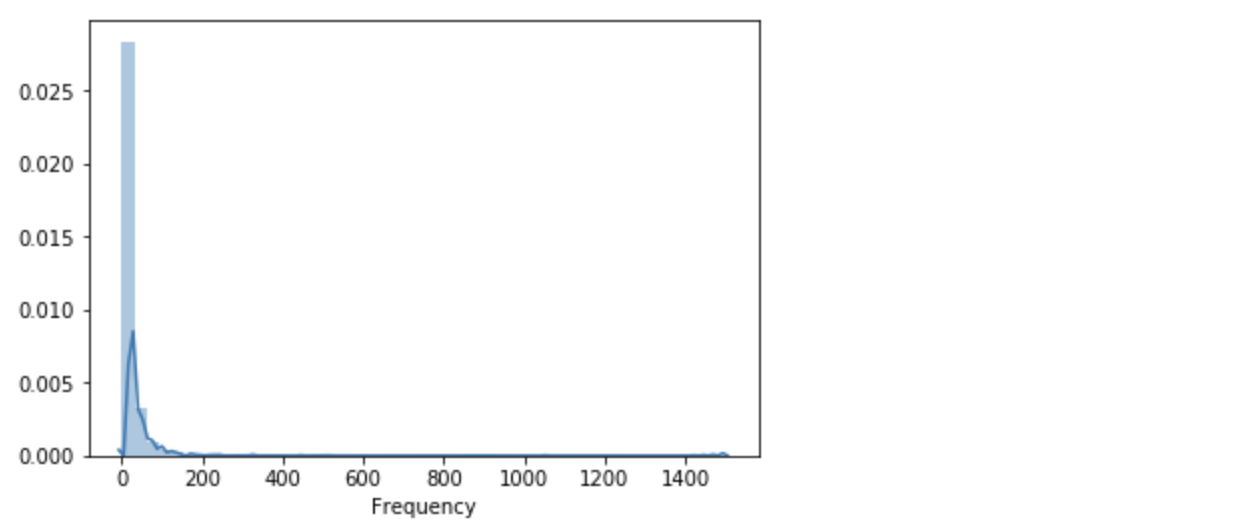
Exploring distribution of frequency
sns.distplot(datamart['Frequency'])
plt.show()
Data transformations to manage skewness
- Logarithmic transformation (positive values only)
import numpy as np frequency_log= np.log(datamart['Frequency'])sns.distplot(frequency_log) plt.show()