Cohort analysis visualization
Customer Segmentation in Python

Karolis Urbonas
Head of Data Science, Amazon
Heatmap
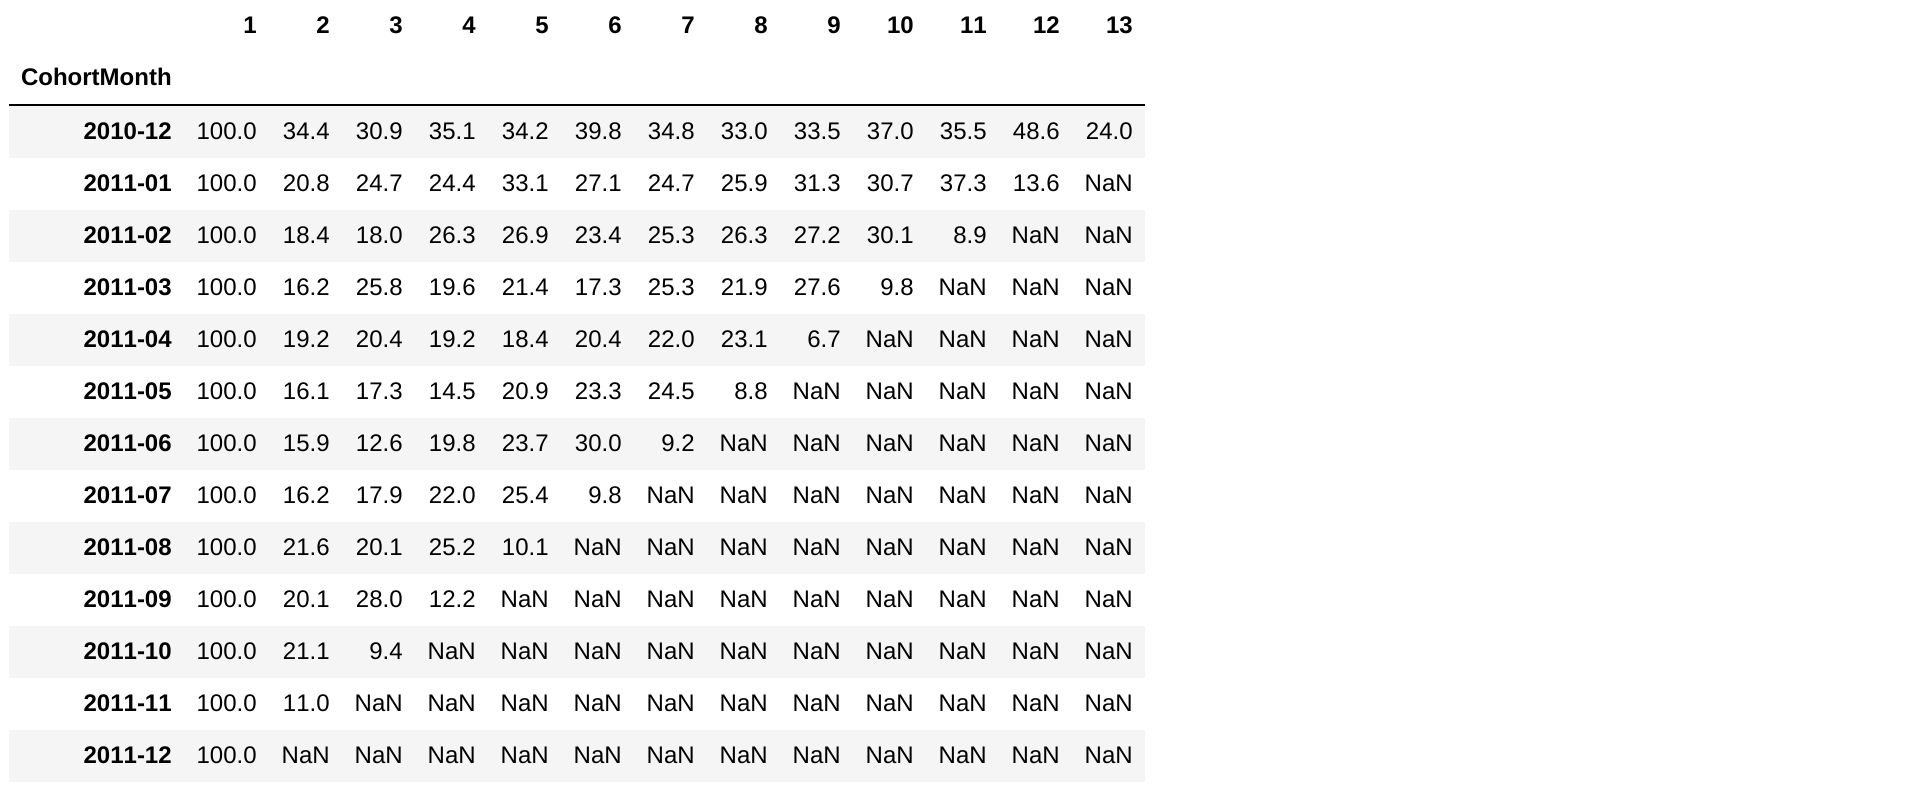
Load the retention table
retention.round(3)*100
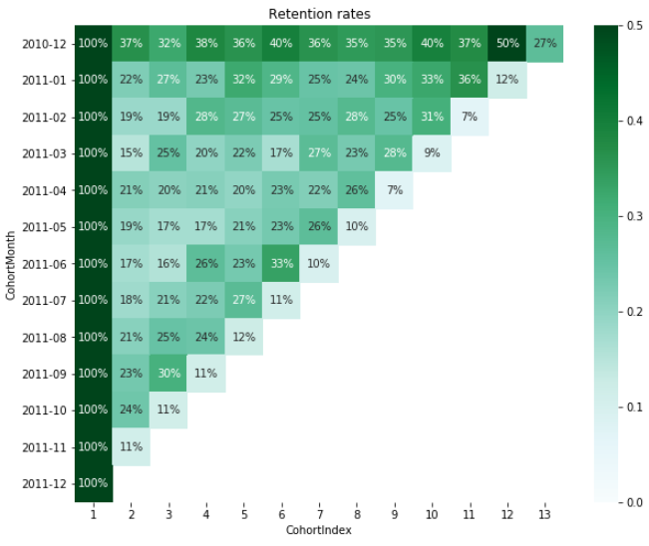
Retention heatmap
Customer Segmentation in Python
Karolis Urbonas
Head of Data Science, Amazon
retention.round(3)*100

