Recency, frequency, monetary (RFM) segmentation
Customer Segmentation in Python

Karolis Urbonas
Head of Data Science, Amazon
Calculate percentiles with Python
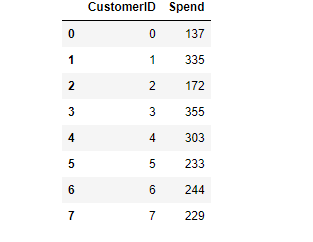
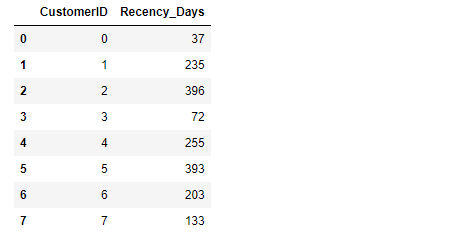
Data with eight CustomerID and a randomly calculated Spend values.
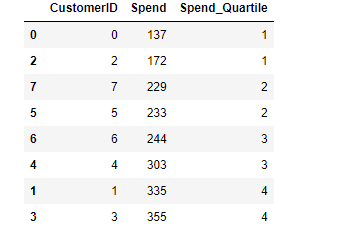
Calculate percentiles with Python
spend_quartiles = pd.qcut(data['Spend'], q=4, labels=range(1,5))data['Spend_Quartile'] = spend_quartilesdata.sort_values('Spend')
Assigning labels
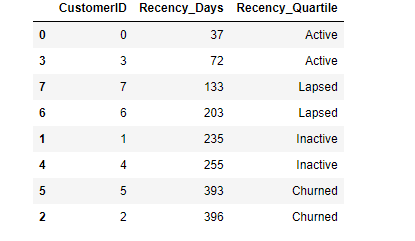
- Highest score to the best metric - best is not always highest e.g. recency
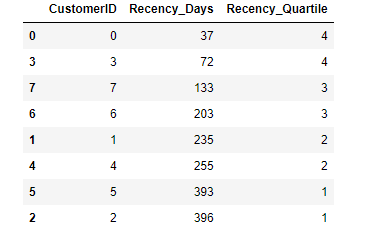
- In this case, the label is inverse - the more recent the customer, the better
Assigning labels
As you can see, the quartile labels are reversed, since the more recent customers are more valuable.
Custom labels
Custom labels assigned to each quartile