Final models evaluation
R For SAS Users

Melinda Higgins, PhD
Research Professor/Senior Biostatistician Emory University
Models by group - men vs women
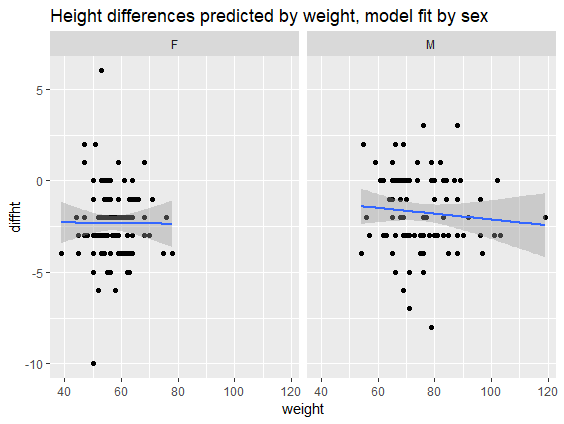
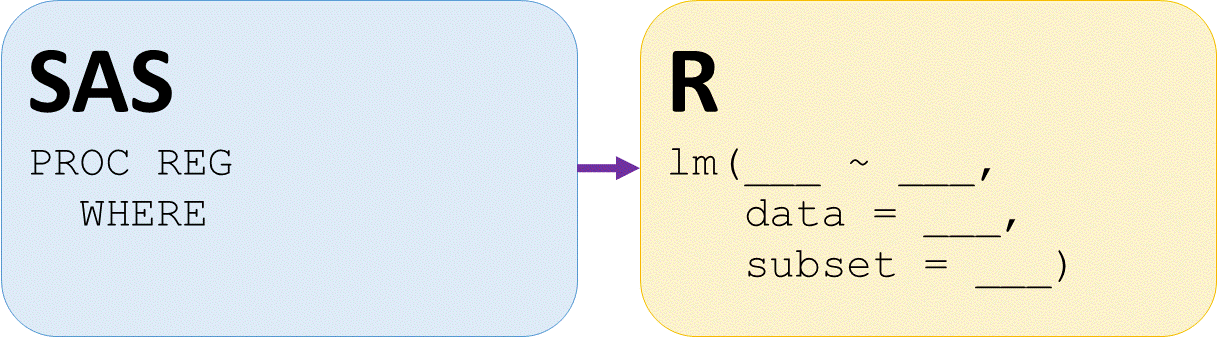
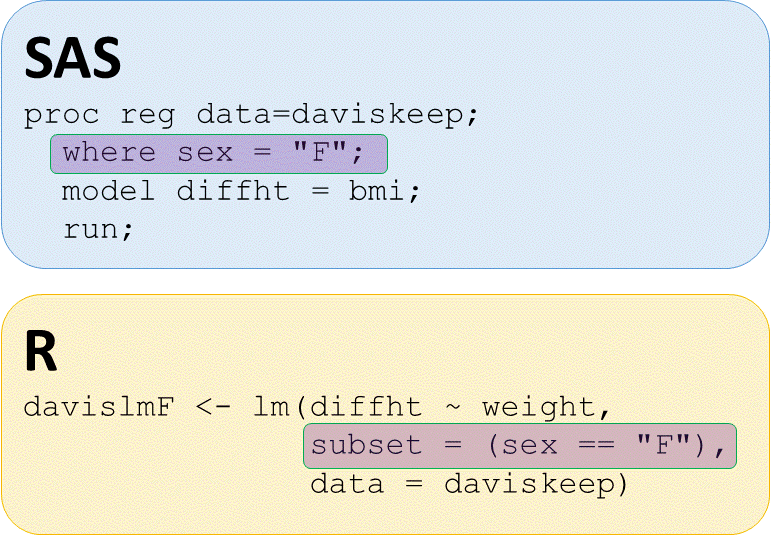
Regression on subset
R For SAS Users
Melinda Higgins, PhD
Research Professor/Senior Biostatistician Emory University

