Exploratory data analysis
R For SAS Users

Melinda Higgins, PhD
Research Professor/Senior Biostatistician Emory University
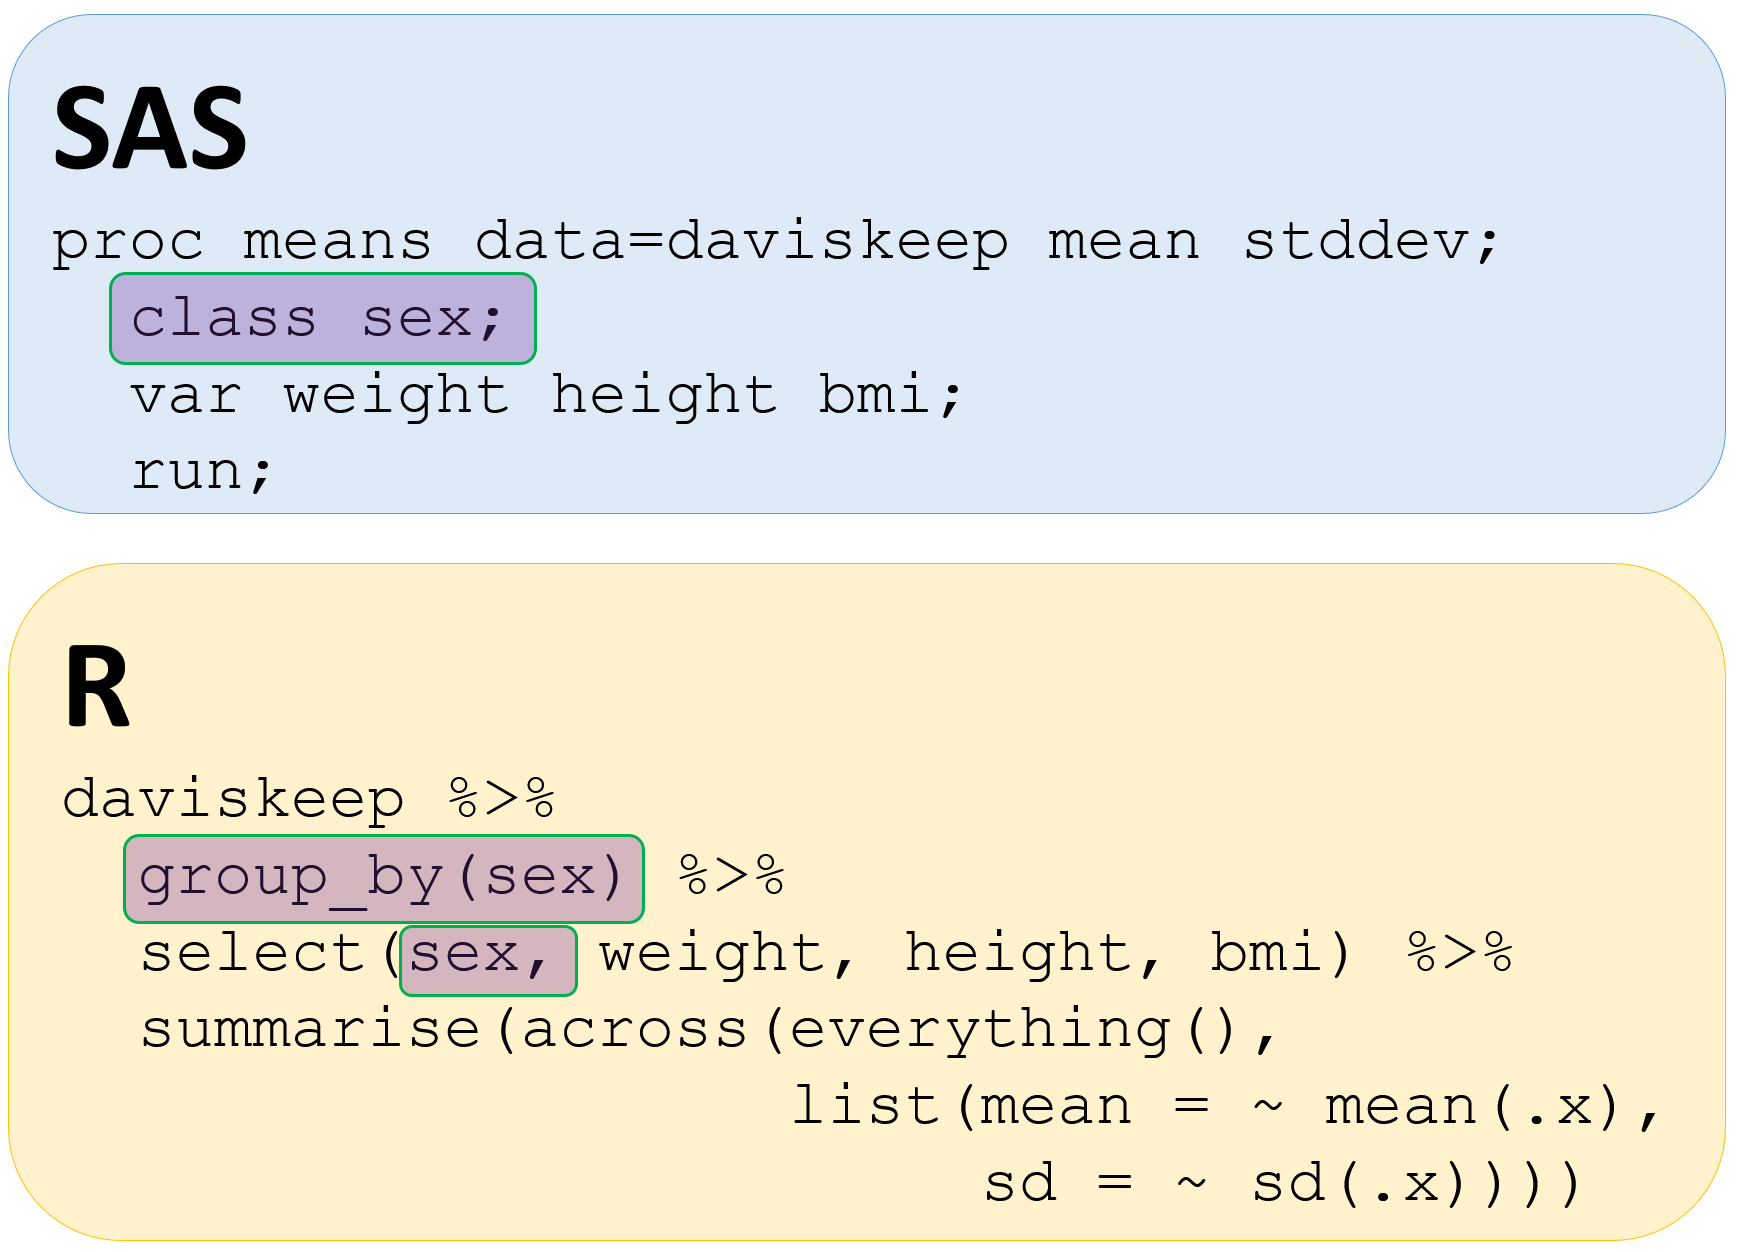
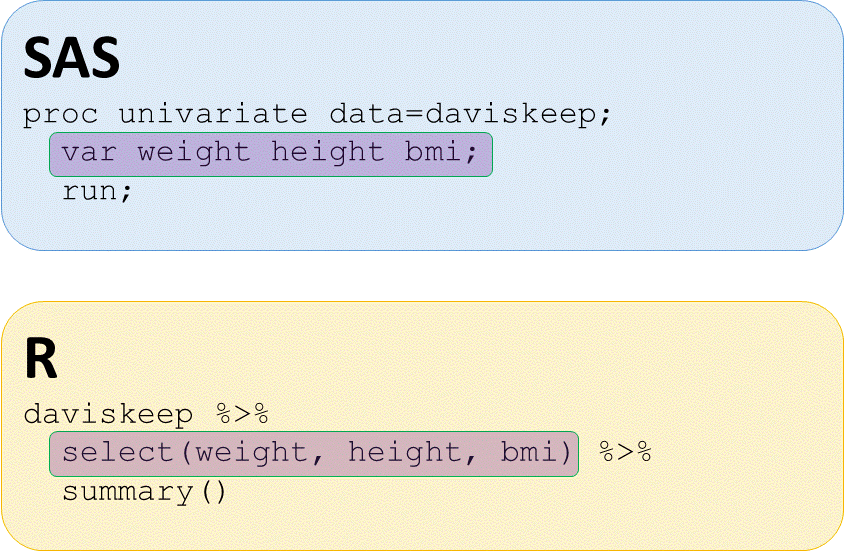
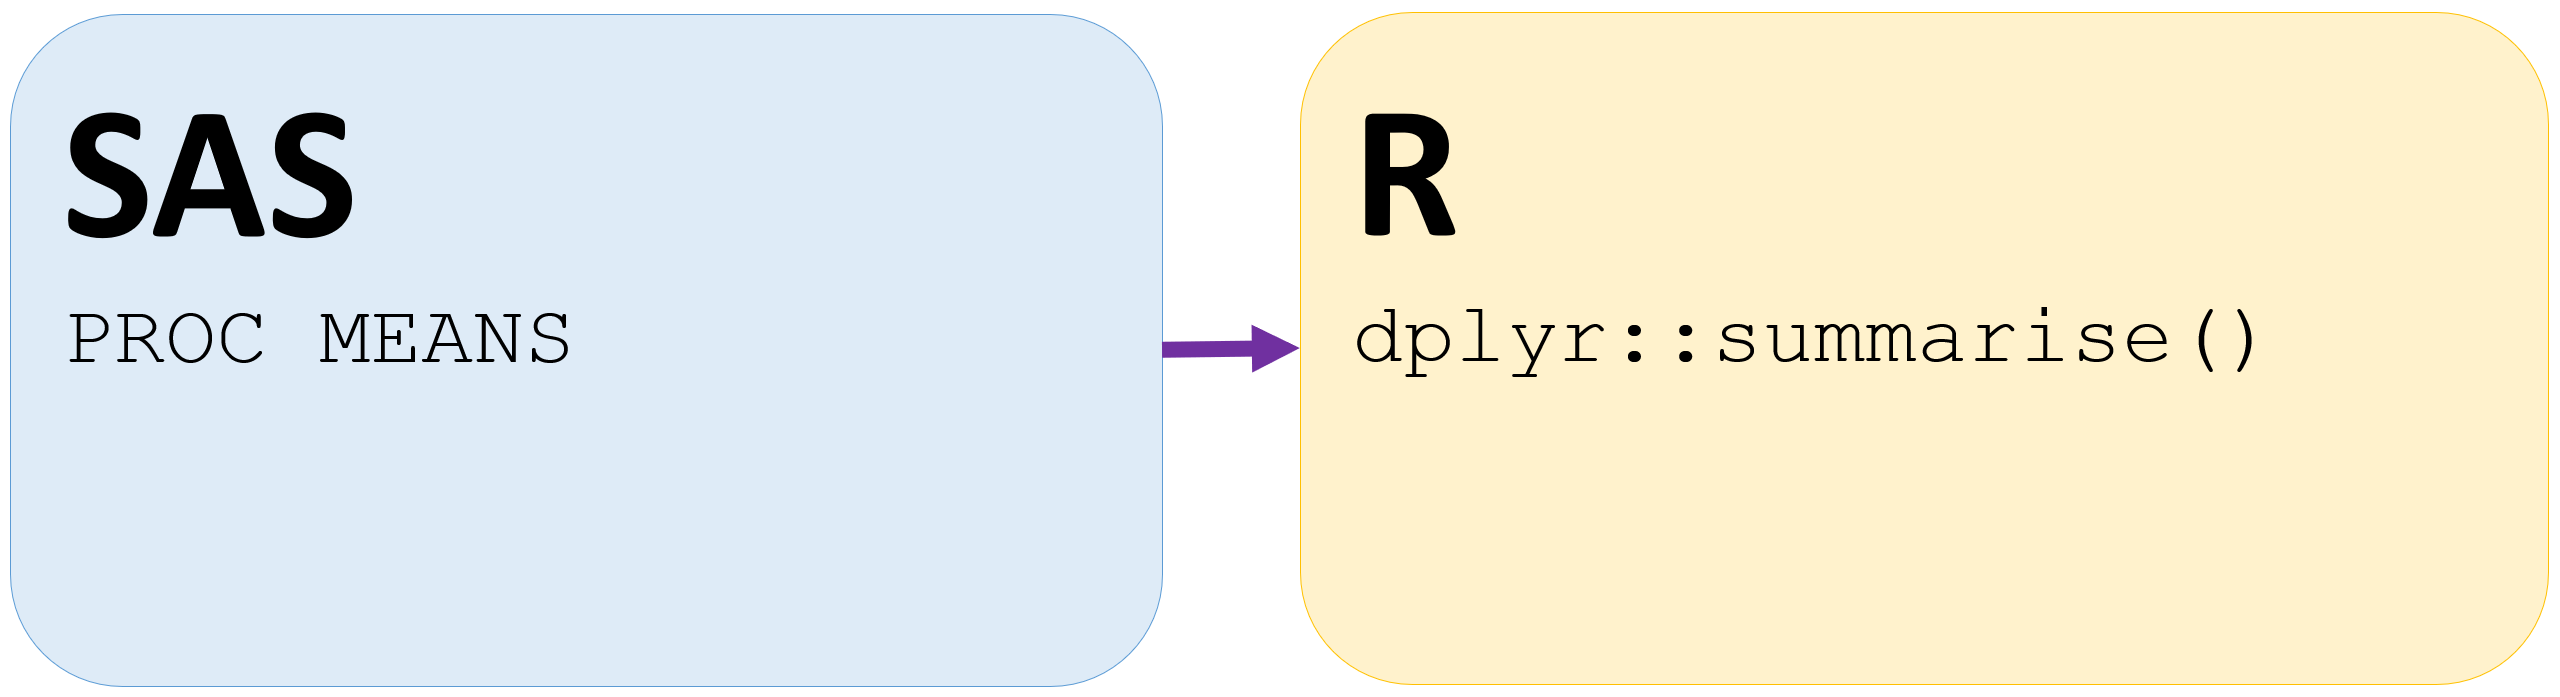
Summary statistics
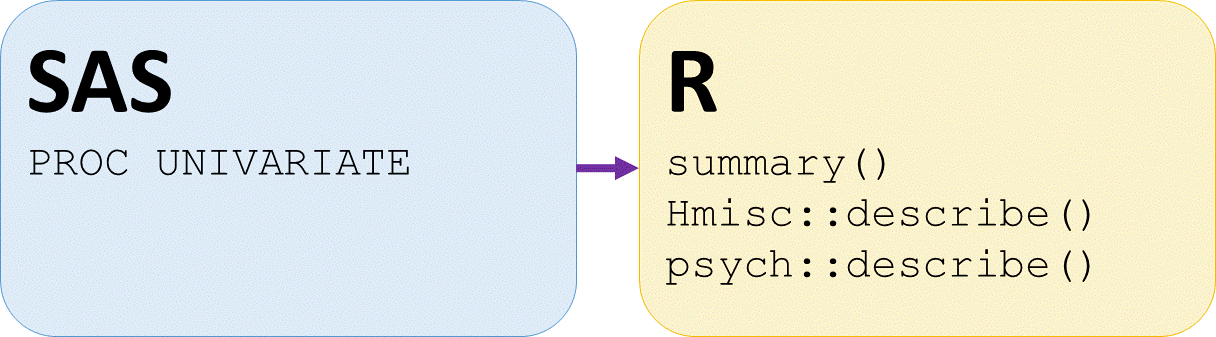
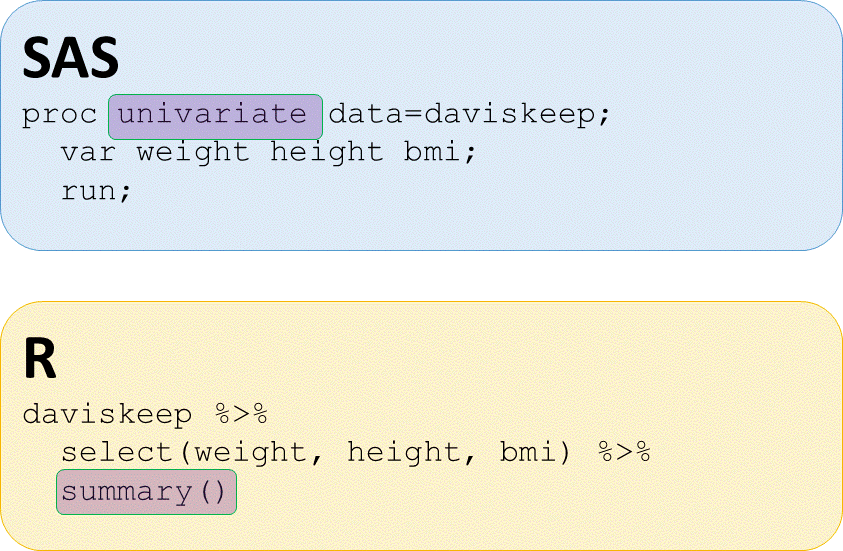
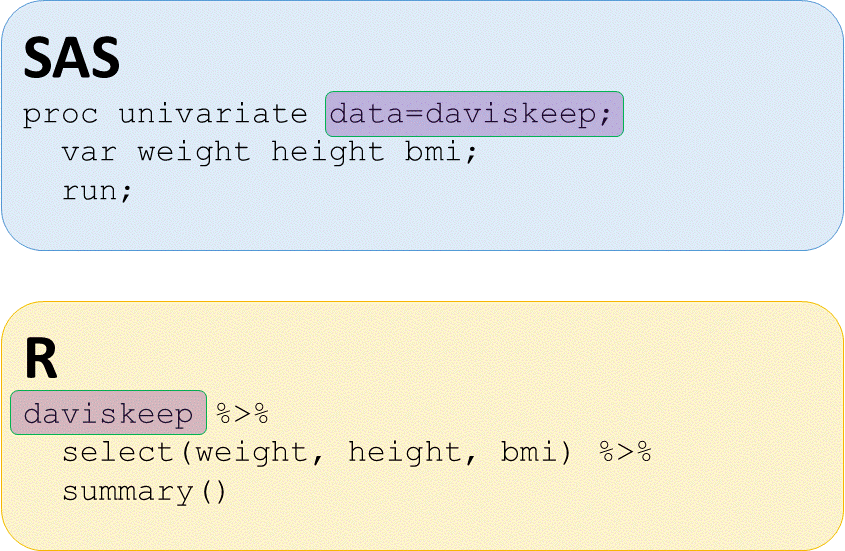
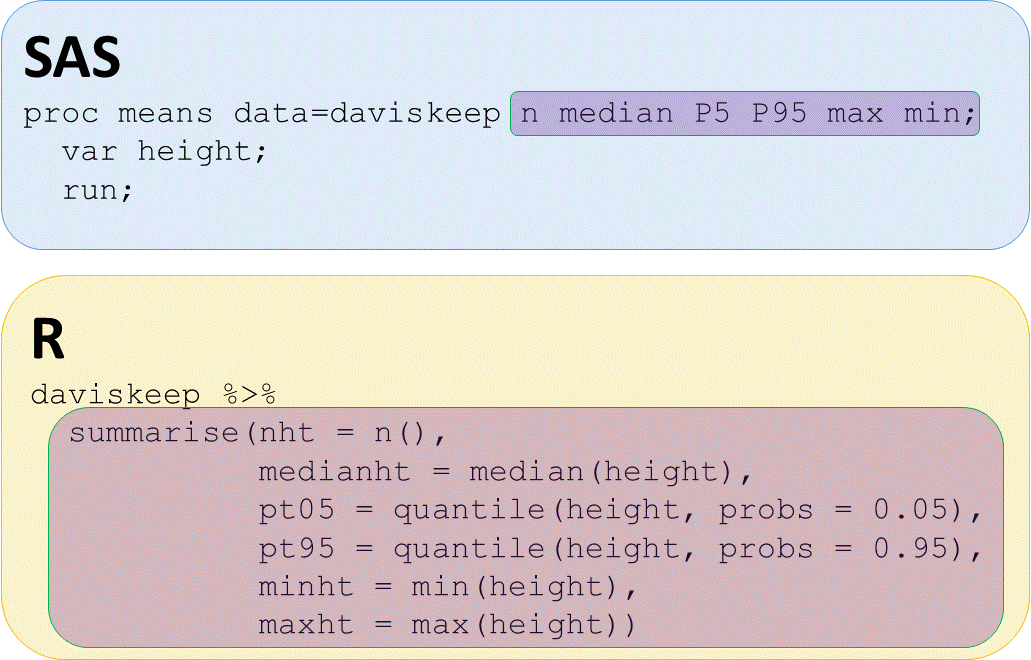
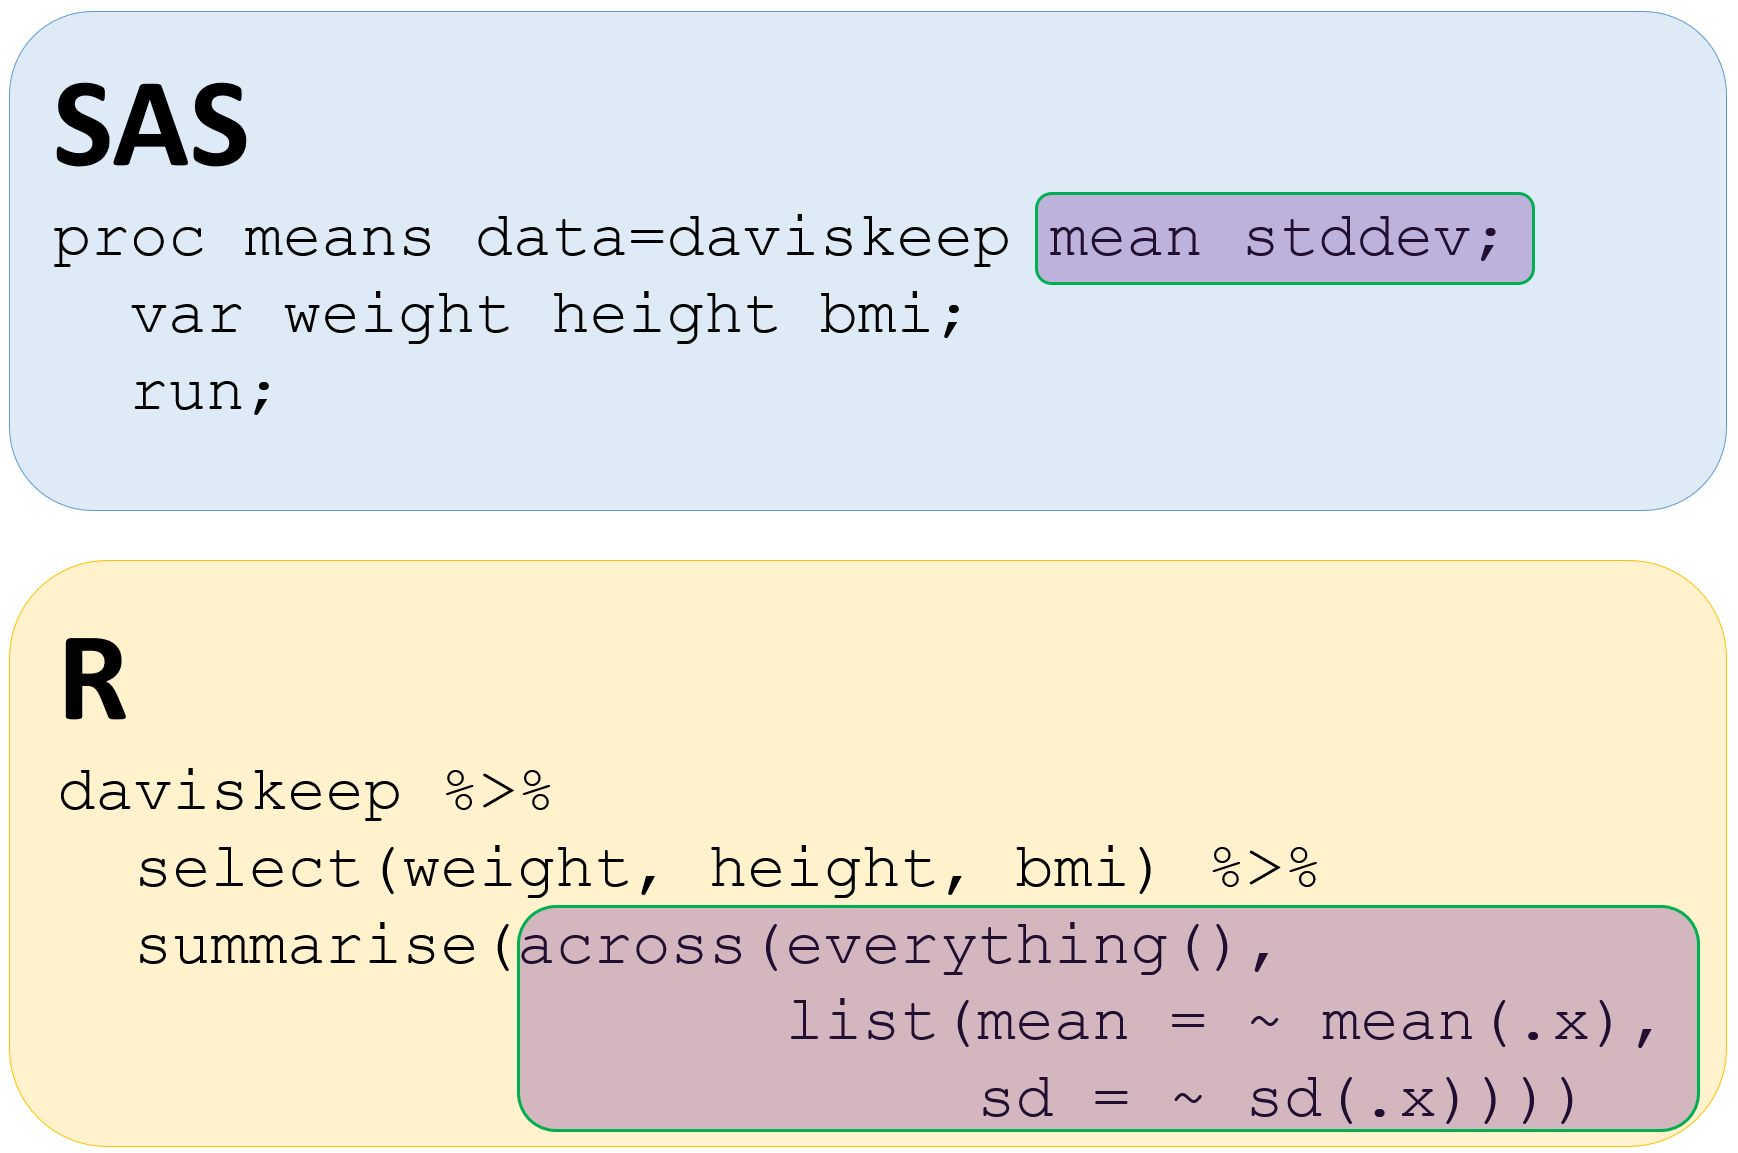
Specific statistic summaries
1 https://dplyr.tidyverse.org/articles/colwise.html
1 https://dplyr.tidyverse.org/articles/colwise.html