Basic Mapping with Geopandas
Analyzing US Census Data in Python

Lee Hachadoorian
Asst. Professor of Instruction, Temple University
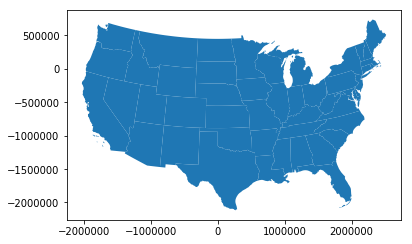
Geopandas Plotting
geo_state.plot()
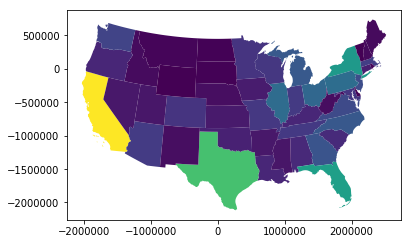
Choropleth Maps
geo_state.plot(column = "has_computer")
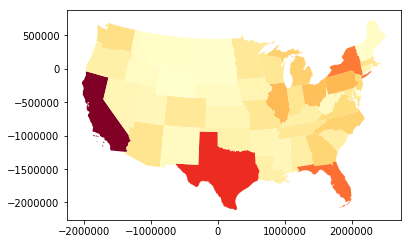
Choropleth Maps
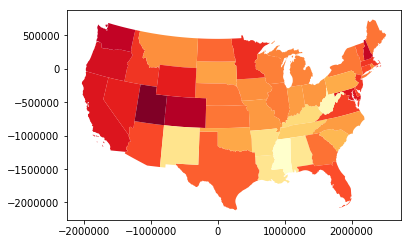
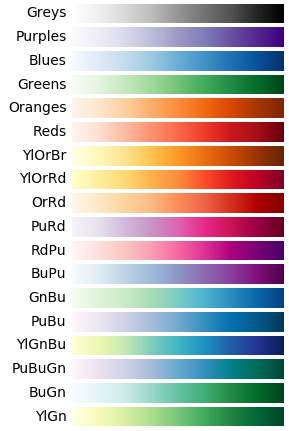
geo_state.plot(column = "has_computer", cmap = "YlOrRd")
Choropleth Maps
geo_state["pct_has_computer"] = 100 * geo_state["has_computer"]/geo_state["total"]geo_state.plot(column = "pct_has_computer", cmap = "YlOrRd")