Neighborhood Change
Analyzing US Census Data in Python

Lee Hachadoorian
Asst. Professor of Instruction, Temple University
What Is Gentrification?
- Disinvestment in urban core
- Declining middle-class population and deteriorating housing stock
- Return of middle and upper-middle class households who renovate older housing stock
- Potential displacement of working class, Black, and immigrant households
Operationalizing Gentrification
- Gentrifiable
- Low median income: Median household income (MHI) below metro area median
- Slow housing construction: New build in previous two decades less than metro area
- Gentrifying
- Increasing educational attainment: % with BA or higher is growing faster than metropolitan area
- Increasing house value: Median house value greater than previous time period (adjusted for inflation)
1 Freeman, Lance. 2005. “Displacement or Succession?: Residential Mobility in Gentrifying Neighborhoods.” Urban Affairs Review 40 (4): 463–91.
Data Sources
- 2000 Census of Population and Housing - Summary File 3
- P53: Median Household Income in 1999 (Dollars)
- H34: Year Structure Built
- P37: Sex by Educational Attainment for the Population 25 Years and Over
- H85: Median Value (Dollars) for All Owner-Occupied Housing Units
- American Community Survey 5-Year Data (2008-20012)
- B15003: Educational Attainment for the Population 25 Years and Over
- B25077: Median Value (Dollars) - Owner-occupied housing units
bk_2000: Brooklyn Census Tracts 2000
state                | State FIPS
county               | County FIPS
tract                | Tract FIPS
geometry             | Geometry column
mhi                  | Median Household Income (tract)
mhi_msa              | Median Household Income (NY Metro Area)
median_value         | Median House Value (tract)
median_value_msa     | Median House Value(NY Metro Area)
pct_recent_build     | Percent of housing built between 1980 and 1999 (tract)
pct_recent_build_msa | Percent of housing built between 1980 and 1999 (NY Metro Area)
pct_ba               | Percentage of 25 year olds with BA or higher (tract)
pct_ba_msa           | Percentage of 25 year olds with BA or higher(NY Metro Area)
Boolean Criteria
bk_2000[["tract", "mhi", "mhi_msa"]].head()
    tract    mhi  mhi_msa
0  051200  31393    50795
1  051300  30000    50795
2  051400  32103    50795
3  051500  36107    50795
4  051600  25148    50795
bk_2000["low_mhi"] = bk_2000["mhi"] < bk_2000["mhi_msa"]
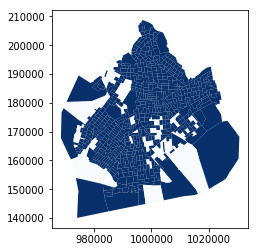
Mapping Low Income Tracts
bk_2000.plot(column = "low_mhi", cmap = "Blues")
Let's practice!
Analyzing US Census Data in Python

