Migration
Analyzing US Census Data in Python

Lee Hachadoorian
Asst. Professor of Instruction, Temple University
Going to California
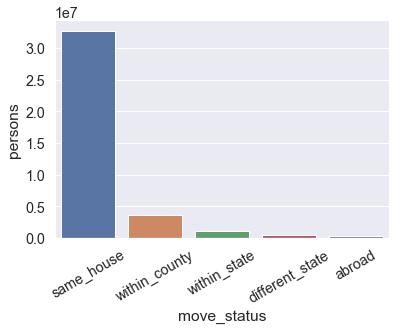
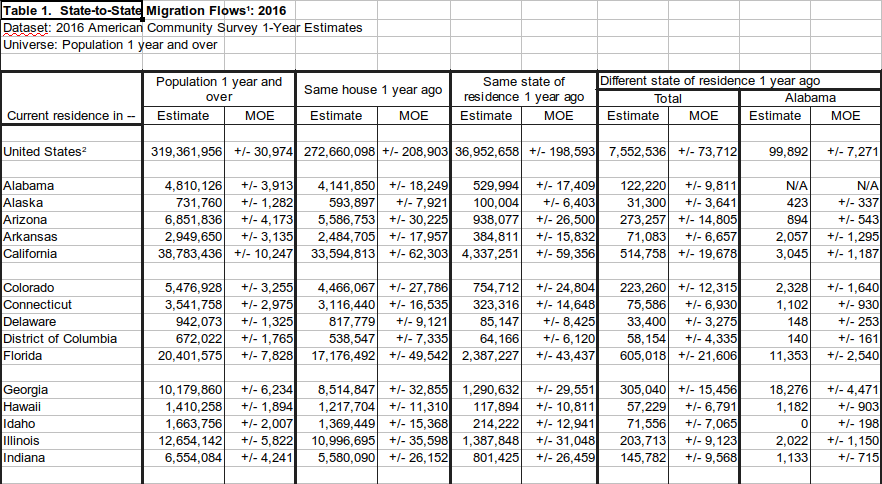
Migration Flows
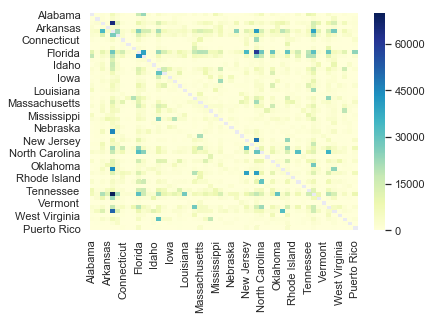
State-to-State Migration Heatmap
sns.heatmap(state_to_state, cmap="YlGnBu")
Analyzing US Census Data in Python
Lee Hachadoorian
Asst. Professor of Instruction, Temple University
sns.heatmap(state_to_state, cmap="YlGnBu")

