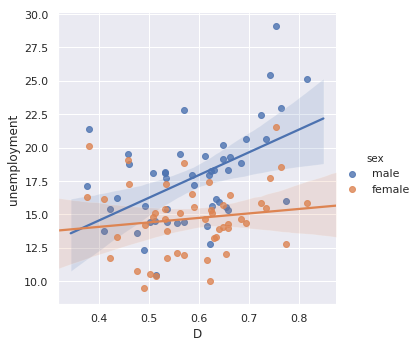
Segregation Impacts: Unemployment
Analyzing US Census Data in Python

Lee Hachadoorian
Asst. Professor of Instruction, Temple University
Deciphering ACS Subject Table IDs
[B|C]ssnnn[A-I]
[B|C]ssnnn[A-I]
B or C = "Base Table" or "Collapsed Table"
| B15002 | C15002[A-I] |
|---|---|
| No schooling | Less than high school diploma |
| Nursery to 4th grade | High school grad, GED, or alt. |
| 5th and 6th grade | Some college or associate's |
| 7th and 8th grade | Bachelor's degree or higher |
| 9th grade | |
| etc... | |
[B|C]ssnnn[A-I]
A= White aloneB= Black or African American AloneC= American Indian and Alaska Native AloneD= Asian AloneE= Native Hawaiian and Other Pacific Islander AloneF= Some Other Race AloneG= Two or More RacesH= White Alone, Not Hispanic or LatinoI= Hispanic or Latino
[B|C]ssnnn[A-I]
- 01 = Age and Sex
- 02 = Race
- 03 = Hispanic or Latino Origin
- 05 = Foreign Born; Citizenship; Year of Entry; Nativity
- 15 = Educational Attainment
- 19 = Income (Households and Families)
- 23 = Employment Status; Work Experience; Labor Force
Source: https://www.census.gov/programs-surveys/acs/guidance/which-data-tool/table-ids-explained.html
Comparing Segregation Impacts

Tidy Data
Wide DataFrame: msa_labor_force
     msa  male_lf  female_lf
0  12060   400843     481425
1  25540    30656      35046
2  26420   231346     268923
3  26900    55943      71036
...
msa_labor_force.columns =
    ["msa", "male", "female"]
Tidy DataFrame: tidy_msa_labor_force
      msa     sex  labor_force
0   12060    male       400843
1   25540    male        30656
2   26420    male       231346
3   26900    male        55943
...
49  12060  female       481425
50  25540  female        35046
51  26420  female       268923
52  26900  female        71036
...
pandas.melt
tidy_msa_labor_force = msa_labor_force.melt(id_vars = ["msa"],value_vars = ["male", "female"],var_name = "sex",value_name = "labor_force" )
pandas.melt
tidy_msa_labor_force
      msa     sex  labor_force
0   12060    male       400843
1   25540    male        30656
2   26420    male       231346
3   26900    male        55943
...
49  12060  female       481425
50  25540  female        35046
51  26420  female       268923
52  26900  female        71036
...
Let's Practice
Analyzing US Census Data in Python

