Visualizing your strategy
Financial Trading in R

Ilya Kipnis
Professional Quantitative Analyst and R programmer
What it looks like
Zoomed in
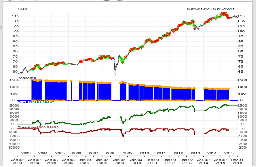
- Use
zoom_Chart("date1/date2")to get a closer look zoom_Chart("2007-08/2007-12")results in:
Financial Trading in R
Ilya Kipnis
Professional Quantitative Analyst and R programmer
zoom_Chart("date1/date2") to get a closer lookzoom_Chart("2007-08/2007-12") results in:

