Principal Component selection
Dimensionality Reduction in Python

Jeroen Boeye
Head of Machine Learning, Faktion
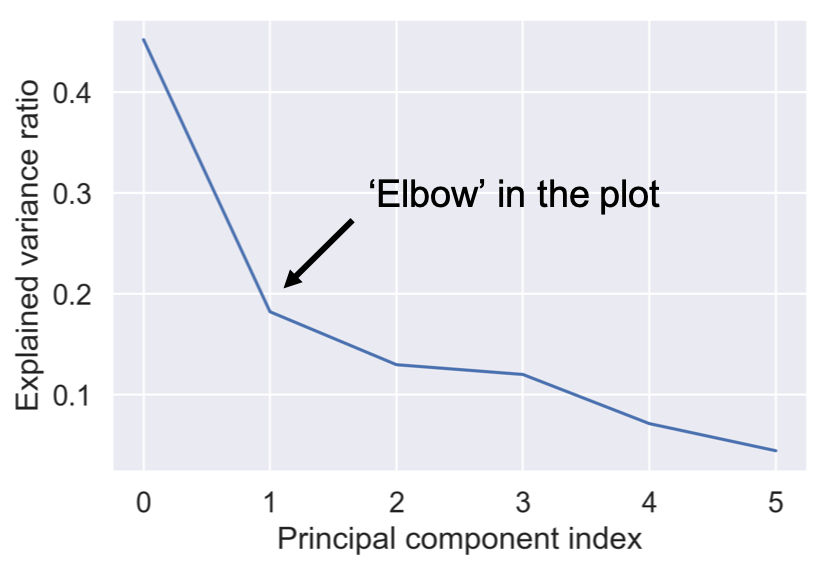
An optimal number of components
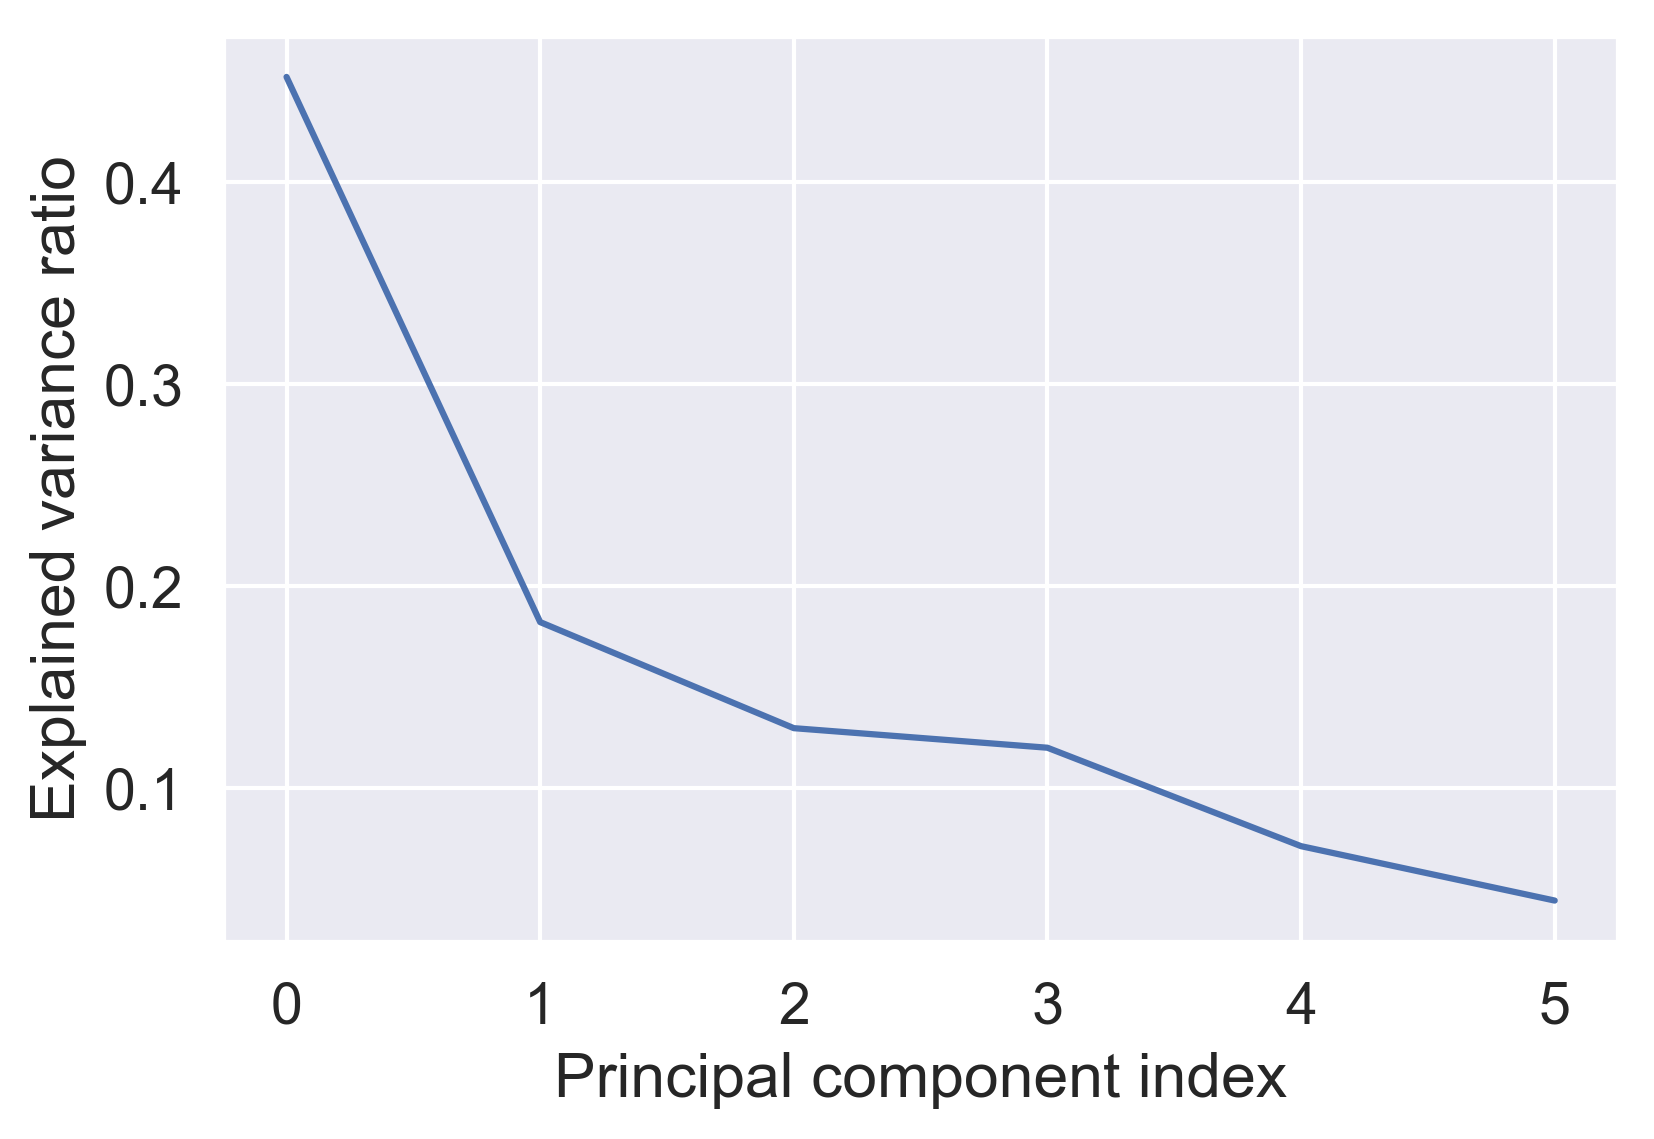
An optimal number of components
PCA operations
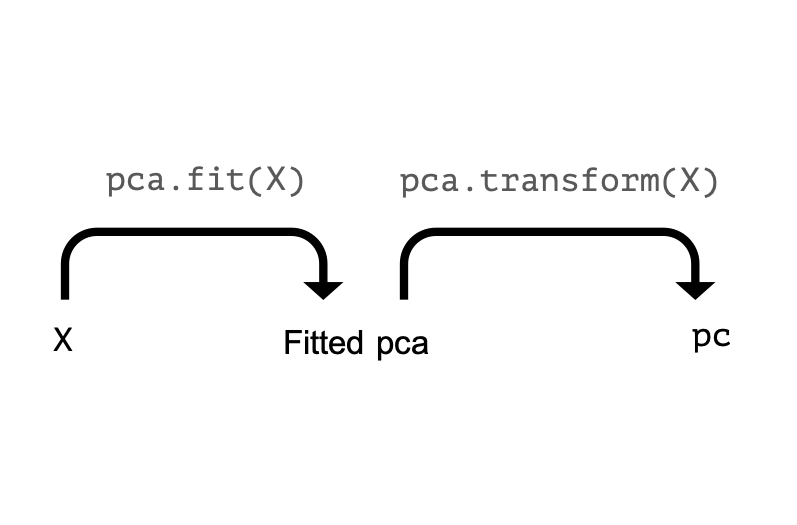
PCA operations
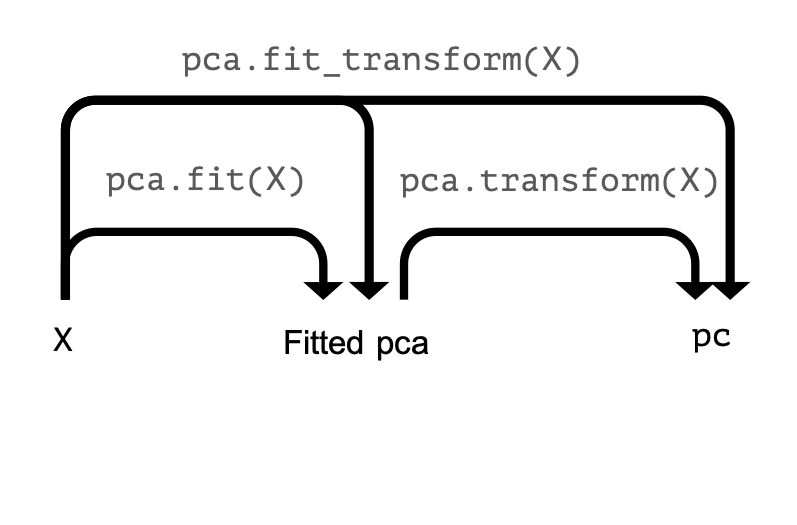
PCA operations

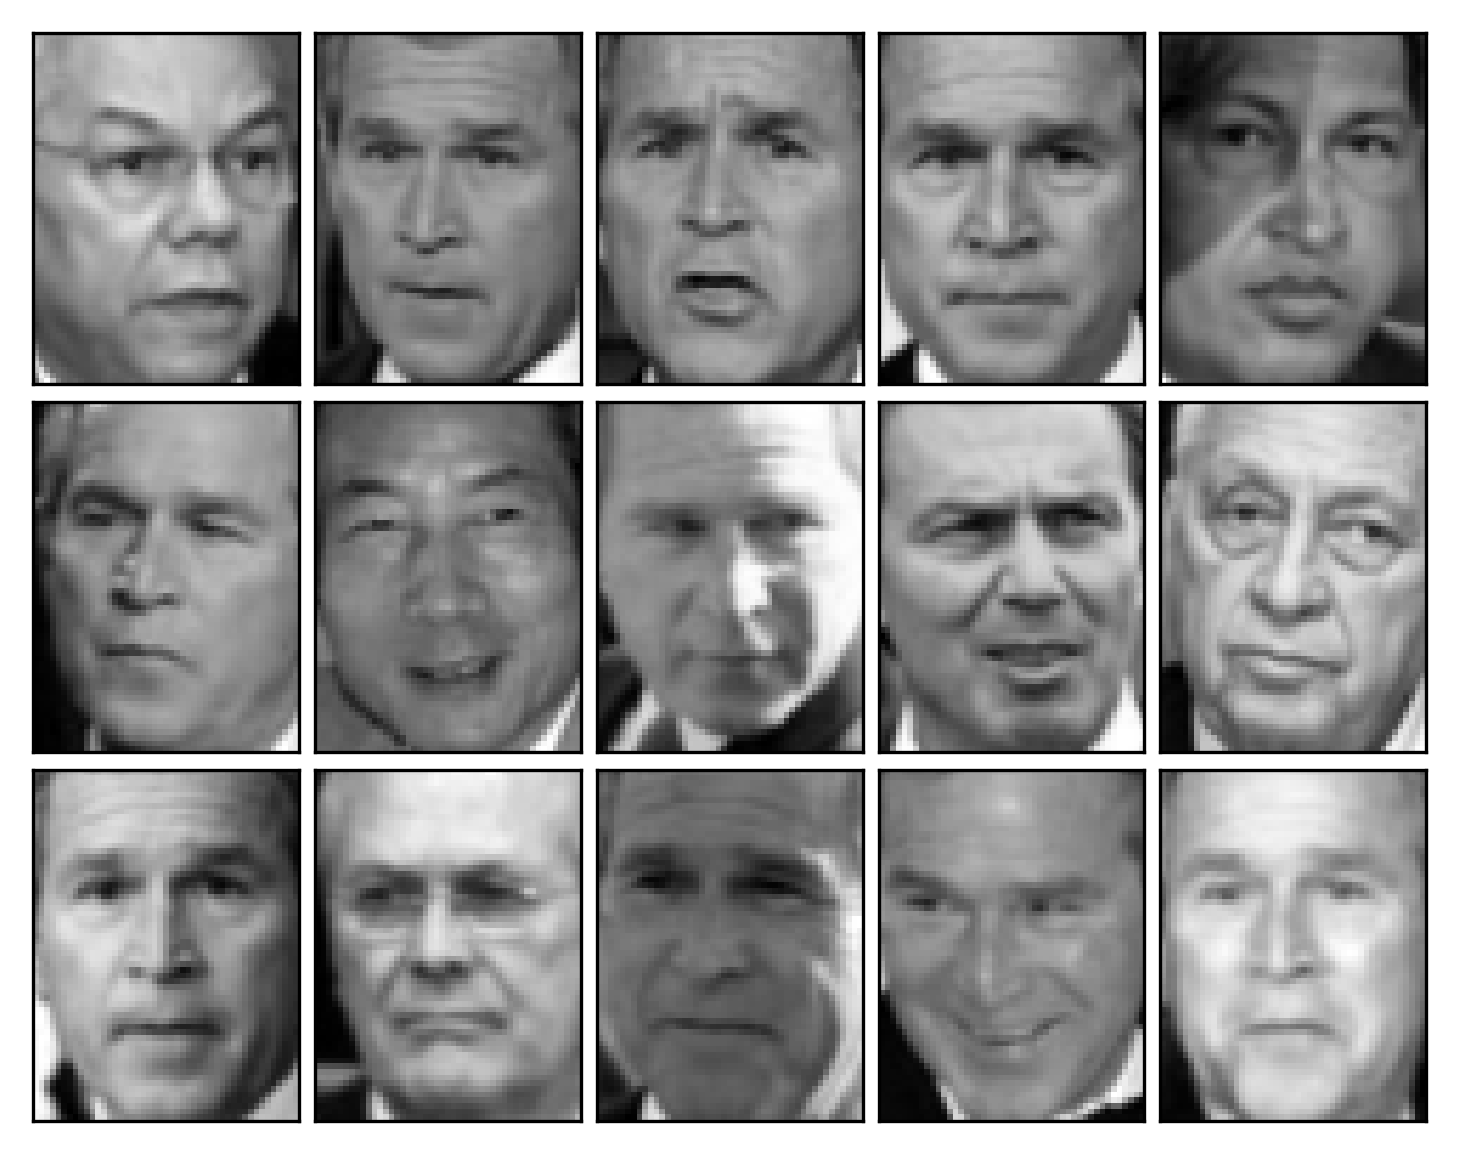
Compressing images
Rebuilding images
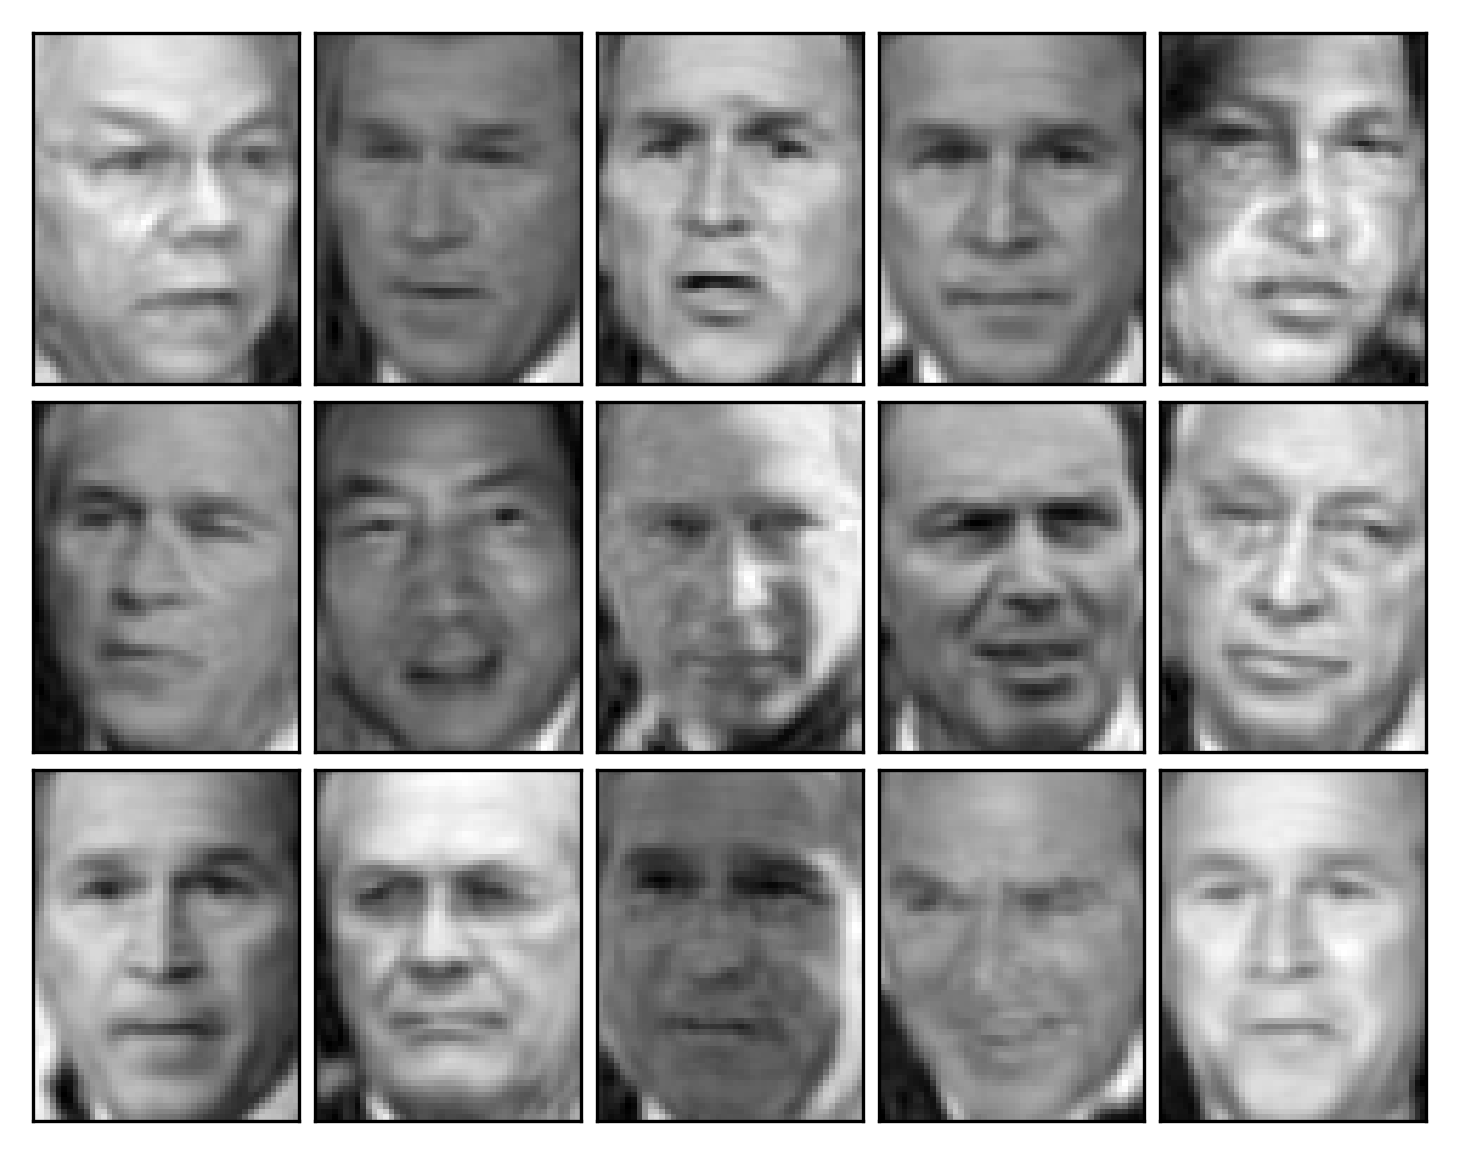
Rebuilding images

