t-SNE visualization of high-dimensional data
Dimensionality Reduction in Python

Jeroen Boeye
Head of Machine Learning, Faktion
t-SNE on IRIS dataset
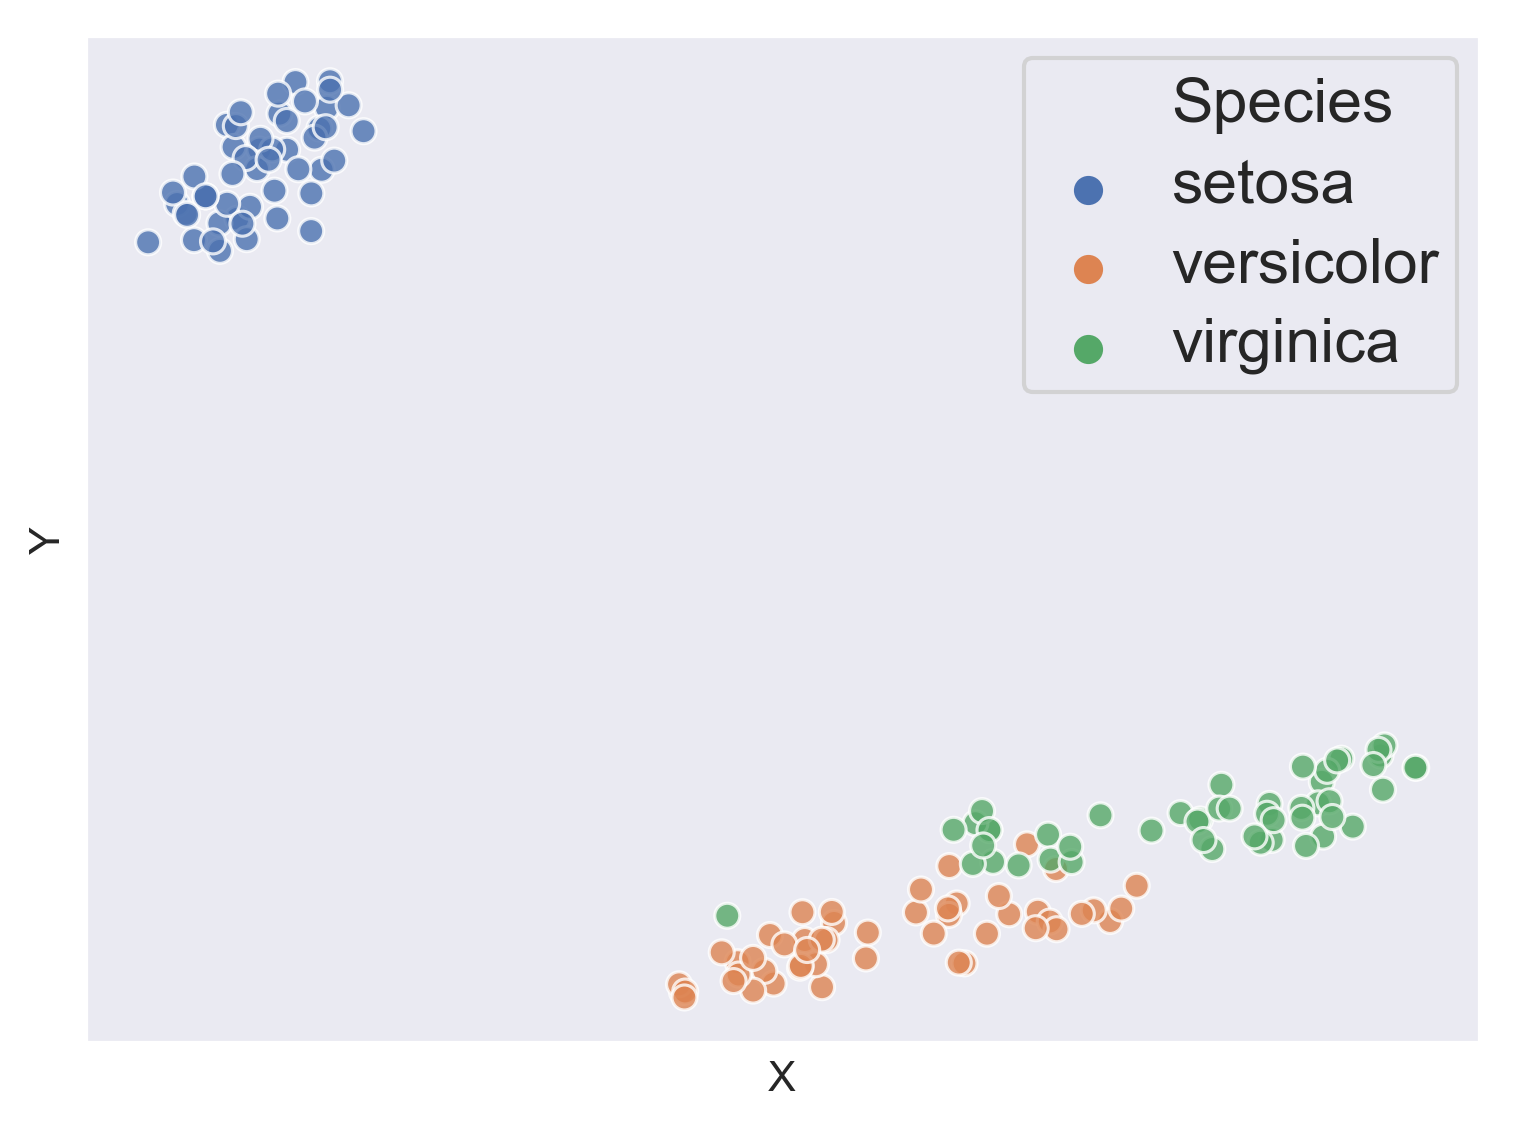
t-SNE on IRIS dataset
t-SNE on IRIS dataset
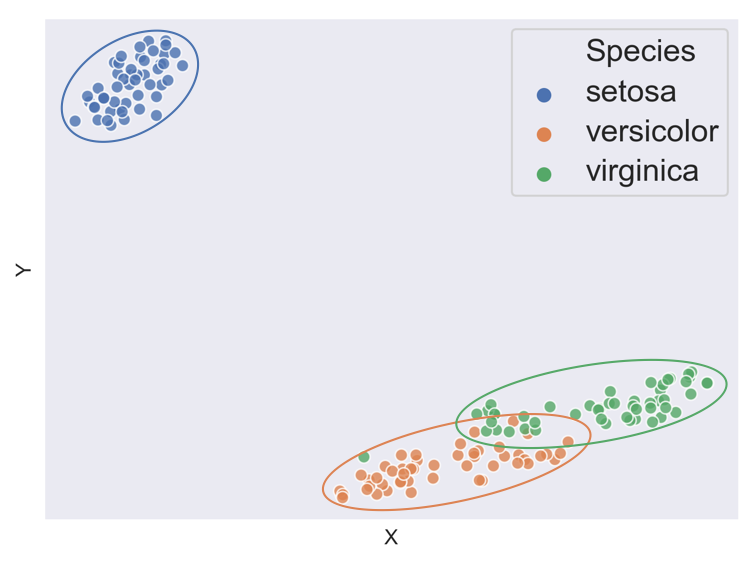
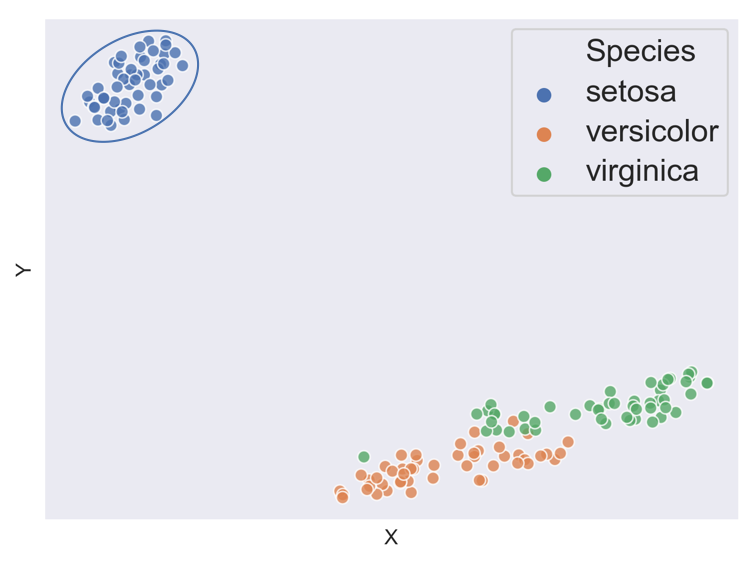
Plotting t-SNE

Coloring points according to BMI category
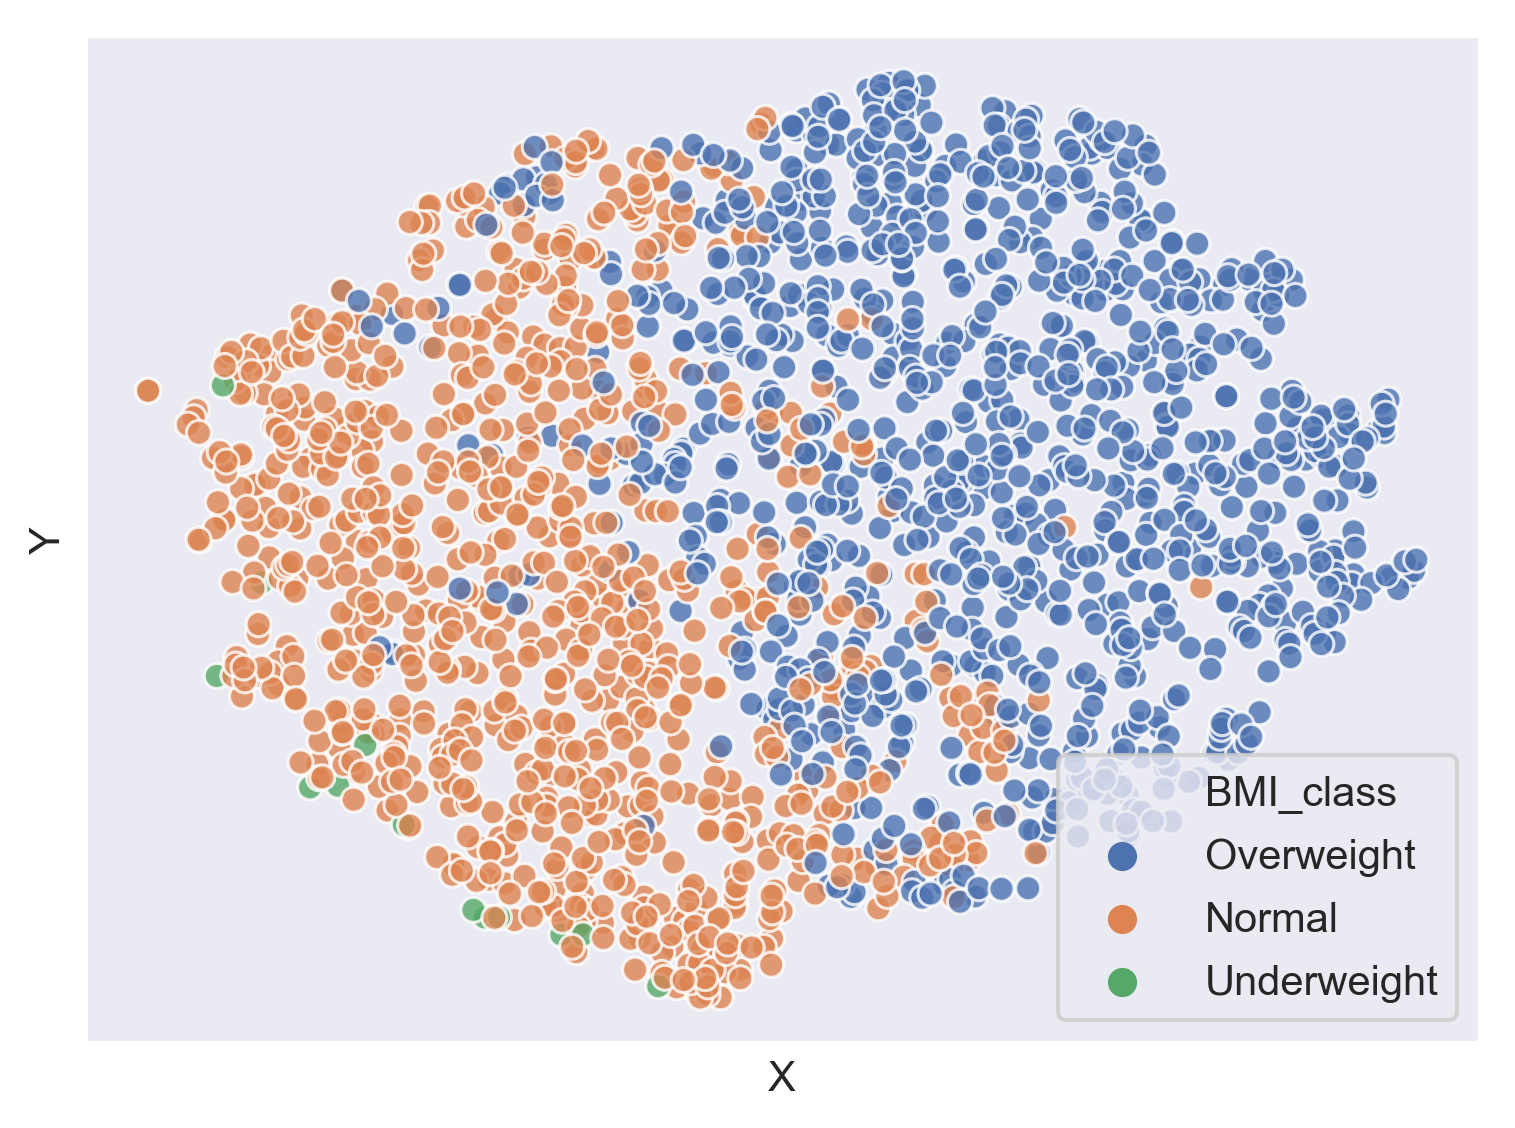
Coloring points according to BMI category
![]()
Coloring points according to height category
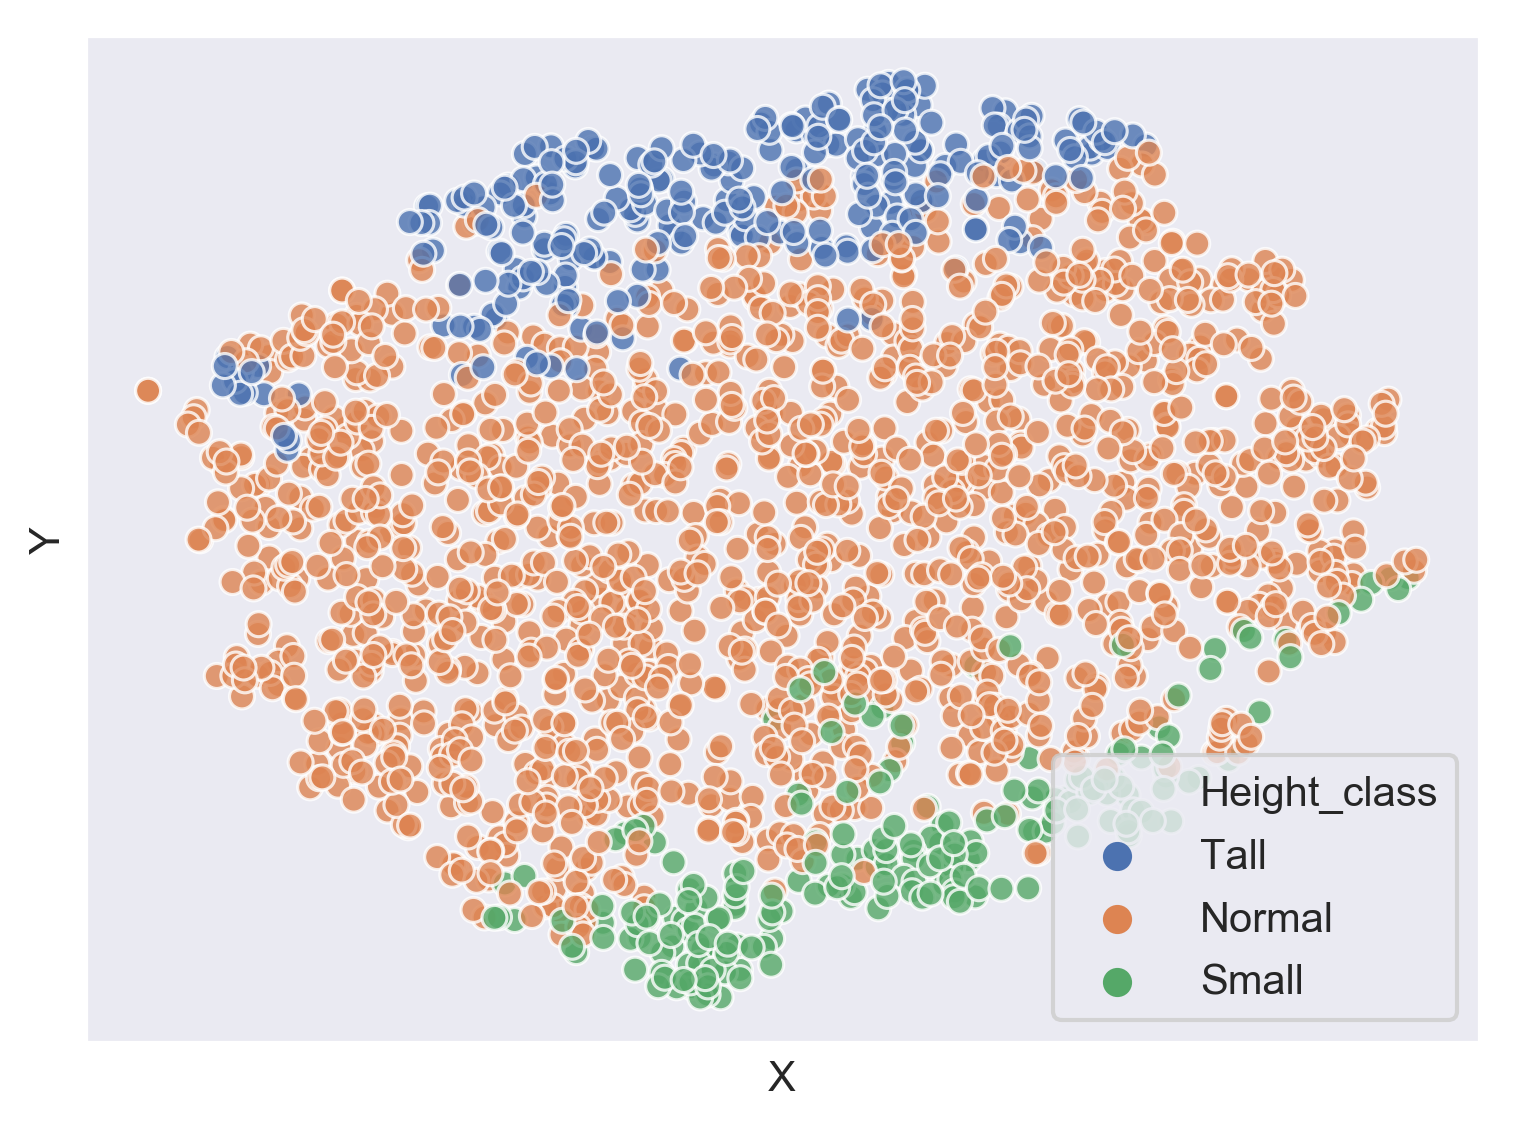
Coloring points according to height category
![]()

