More Summary Functions

Exploratory Data Analysis in SQL

Christina Maimone

Data Scientist

Correlation

Scatterplots of data points with positive and negative correlations

Exploratory Data Analysis in SQL

Correlation function

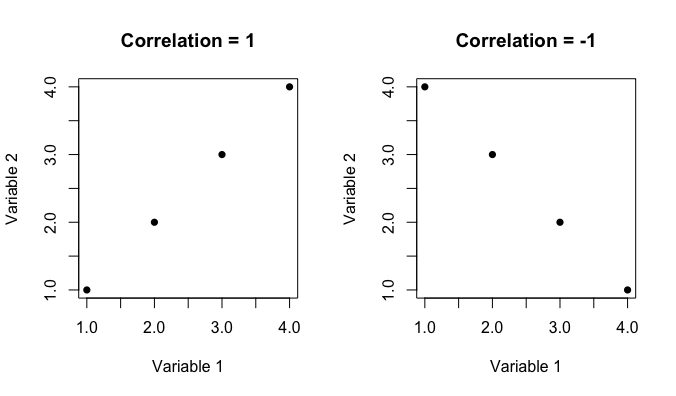
SELECT corr(assets, equity) 
  FROM fortune500;
       corr        
-------------------
 0.637710143588615
(1 row)
Exploratory Data Analysis in SQL

Median

1 1 4 4 4 5 6 7 13 19 20 20 21 21 22
              ^
            median
        50th percentile

^                                  ^
0th percentile      100th percentile
Exploratory Data Analysis in SQL

Percentile functions

SELECT percentile_disc(percentile) WITHIN GROUP (ORDER BY column_name)
  FROM table;

-- percentile between 0 and 1
  • Returns a value from column


SELECT percentile_cont(percentile) WITHIN GROUP (ORDER BY column_name)
  FROM table;
  • Interpolates between values
Exploratory Data Analysis in SQL

Percentile examples

SELECT val
  FROM nums;
 val 
-----
   1
   3
   4
   5
(4 rows)
SELECT percentile_disc(.5) WITHIN GROUP (ORDER BY val),
       percentile_cont(.5) WITHIN GROUP (ORDER BY val)
  FROM nums;
 percentile_disc | percentile_cont 
-----------------+-----------------
               3 |             3.5
Exploratory Data Analysis in SQL

Common issues

  • Error codes
    • Examples: 9, 99, -99
  • Missing value codes
    • NA, NaN, N/A, #N/A
    • 0 = missing or 0?
  • Outlier (extreme) values
    • Really high or low?
    • Negative values?
  • Not really a number
    • Examples: zip codes, survey response categories
Exploratory Data Analysis in SQL

Let's practice!

Exploratory Data Analysis in SQL

Preparing Video For Download...