Adding some style
Introduction to Data Science in Python

Hillary Green-Lerman
Senior Curriculum Lead, DataCamp
And miles to go

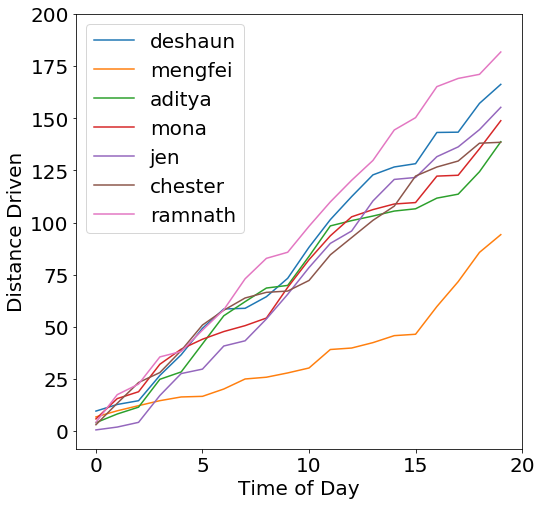
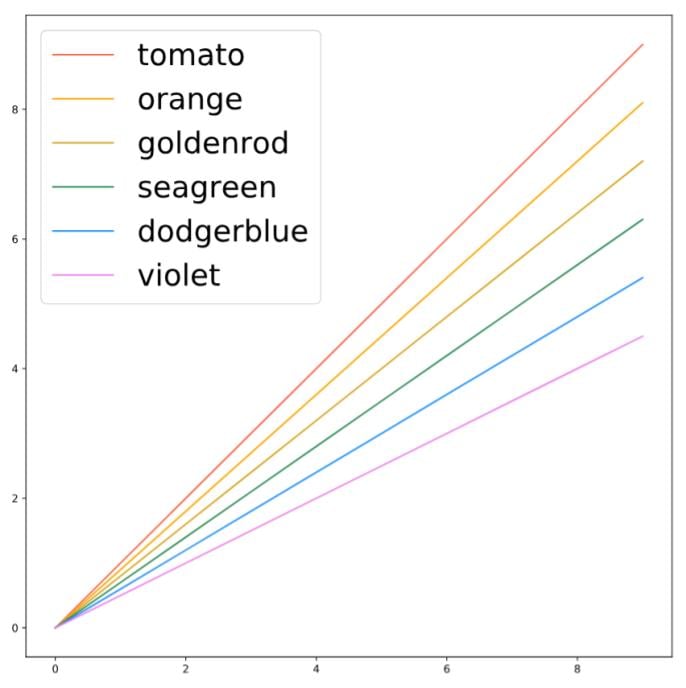
Changing line color
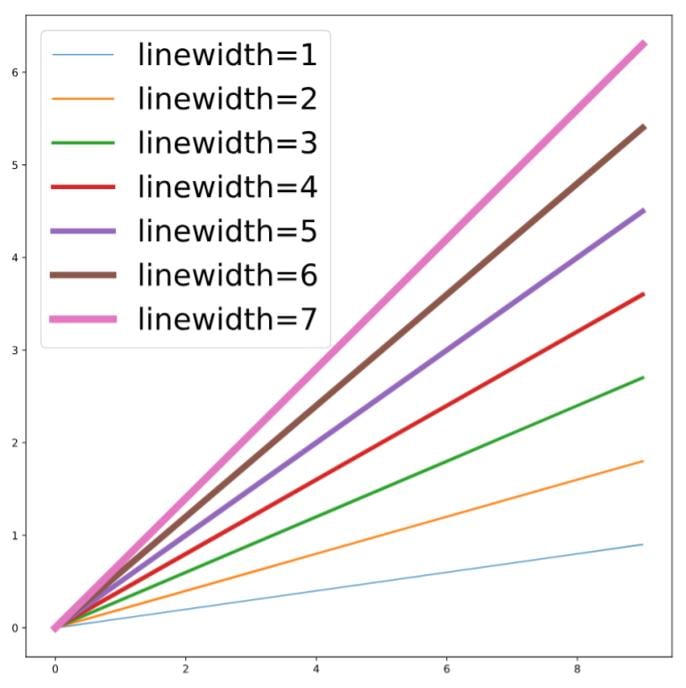
Changing line width
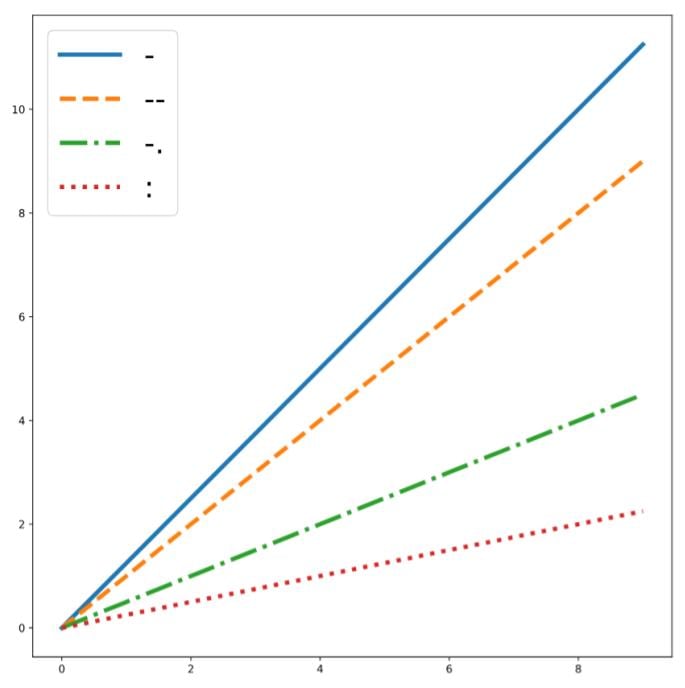
Changing line style
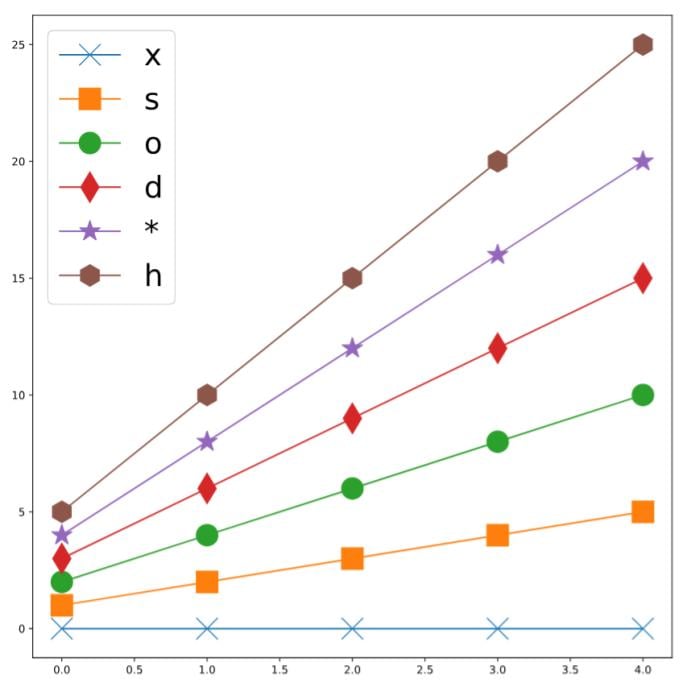
Adding markers
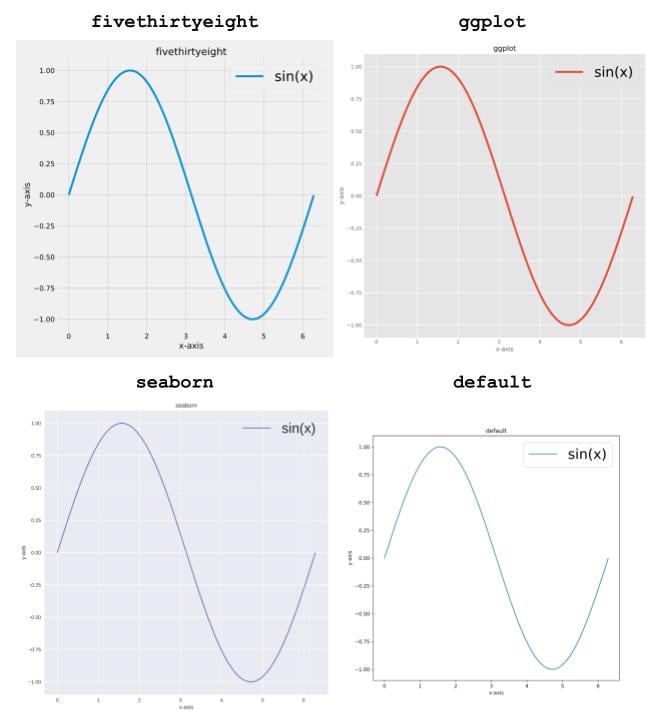
Setting a style
Introduction to Data Science in Python
Hillary Green-Lerman
Senior Curriculum Lead, DataCamp

