Introduction to Data Visualization with Matplotlib
Introduction to Data Visualization with Matplotlib

Ariel Rokem
Data Scientist
Data visualization

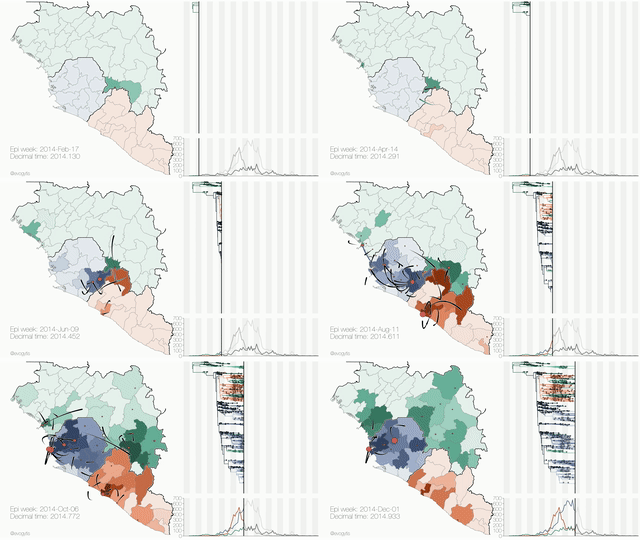
Image credit: Gytis Dudas and Andrew Rambaut
Introducing the pyplot interface
import matplotlib.pyplot as pltfig, ax = plt.subplots()plt.show()

Adding data to axes
seattle_weather["MONTH"]
DATE
1     Jan
2     Feb
3     Mar
4     Apr
5     May
6     Jun
7     Jul
8     Aug
9     Sep
10    Oct
11    Nov
12    Dec
Name: MONTH, dtype: object
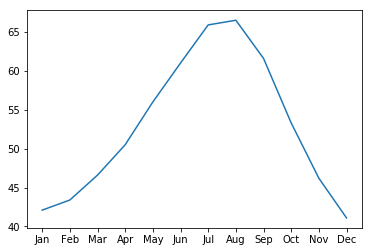
seattle_weather["MLY-TAVG-NORMAL"]
1     42.1
2     43.4
3     46.6
4     50.5
5     56.0
6     61.0
7     65.9
8     66.5
9     61.6
10    53.3
11    46.2
12    41.1
Name: MLY-TAVG-NORMAL, dtype: float64
Adding data to axes
ax.plot(seattle_weather["MONTH"], seattle_weather["MLY-TAVG-NORMAL"])
plt.show()

Adding more data
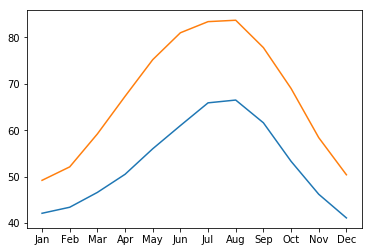
ax.plot(austin_weather["MONTH"], austin_weather["MLY-TAVG-NORMAL"])
plt.show()

Putting it all together
fig, ax = plt.subplots()
ax.plot(seattle_weather["MONTH"], seattle_weather["MLY-TAVG-NORMAL"])
ax.plot(austin_weather["MONTH"], austin_weather["MLY-TAVG-NORMAL"])
plt.show()

Practice making a figure!
Introduction to Data Visualization with Matplotlib

