Where to go next
Introduction to Data Visualization with Matplotlib

Ariel Rokem
Data Scientist
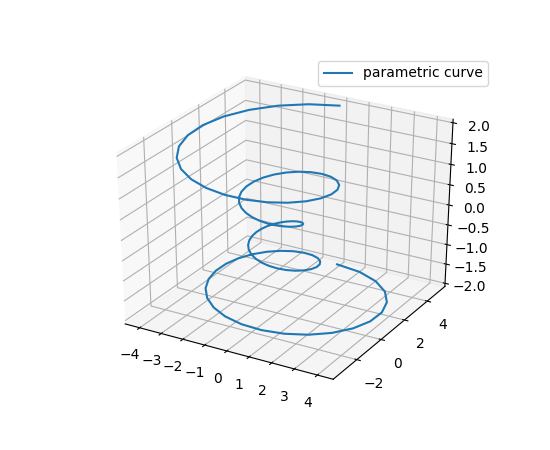
Gallery of examples
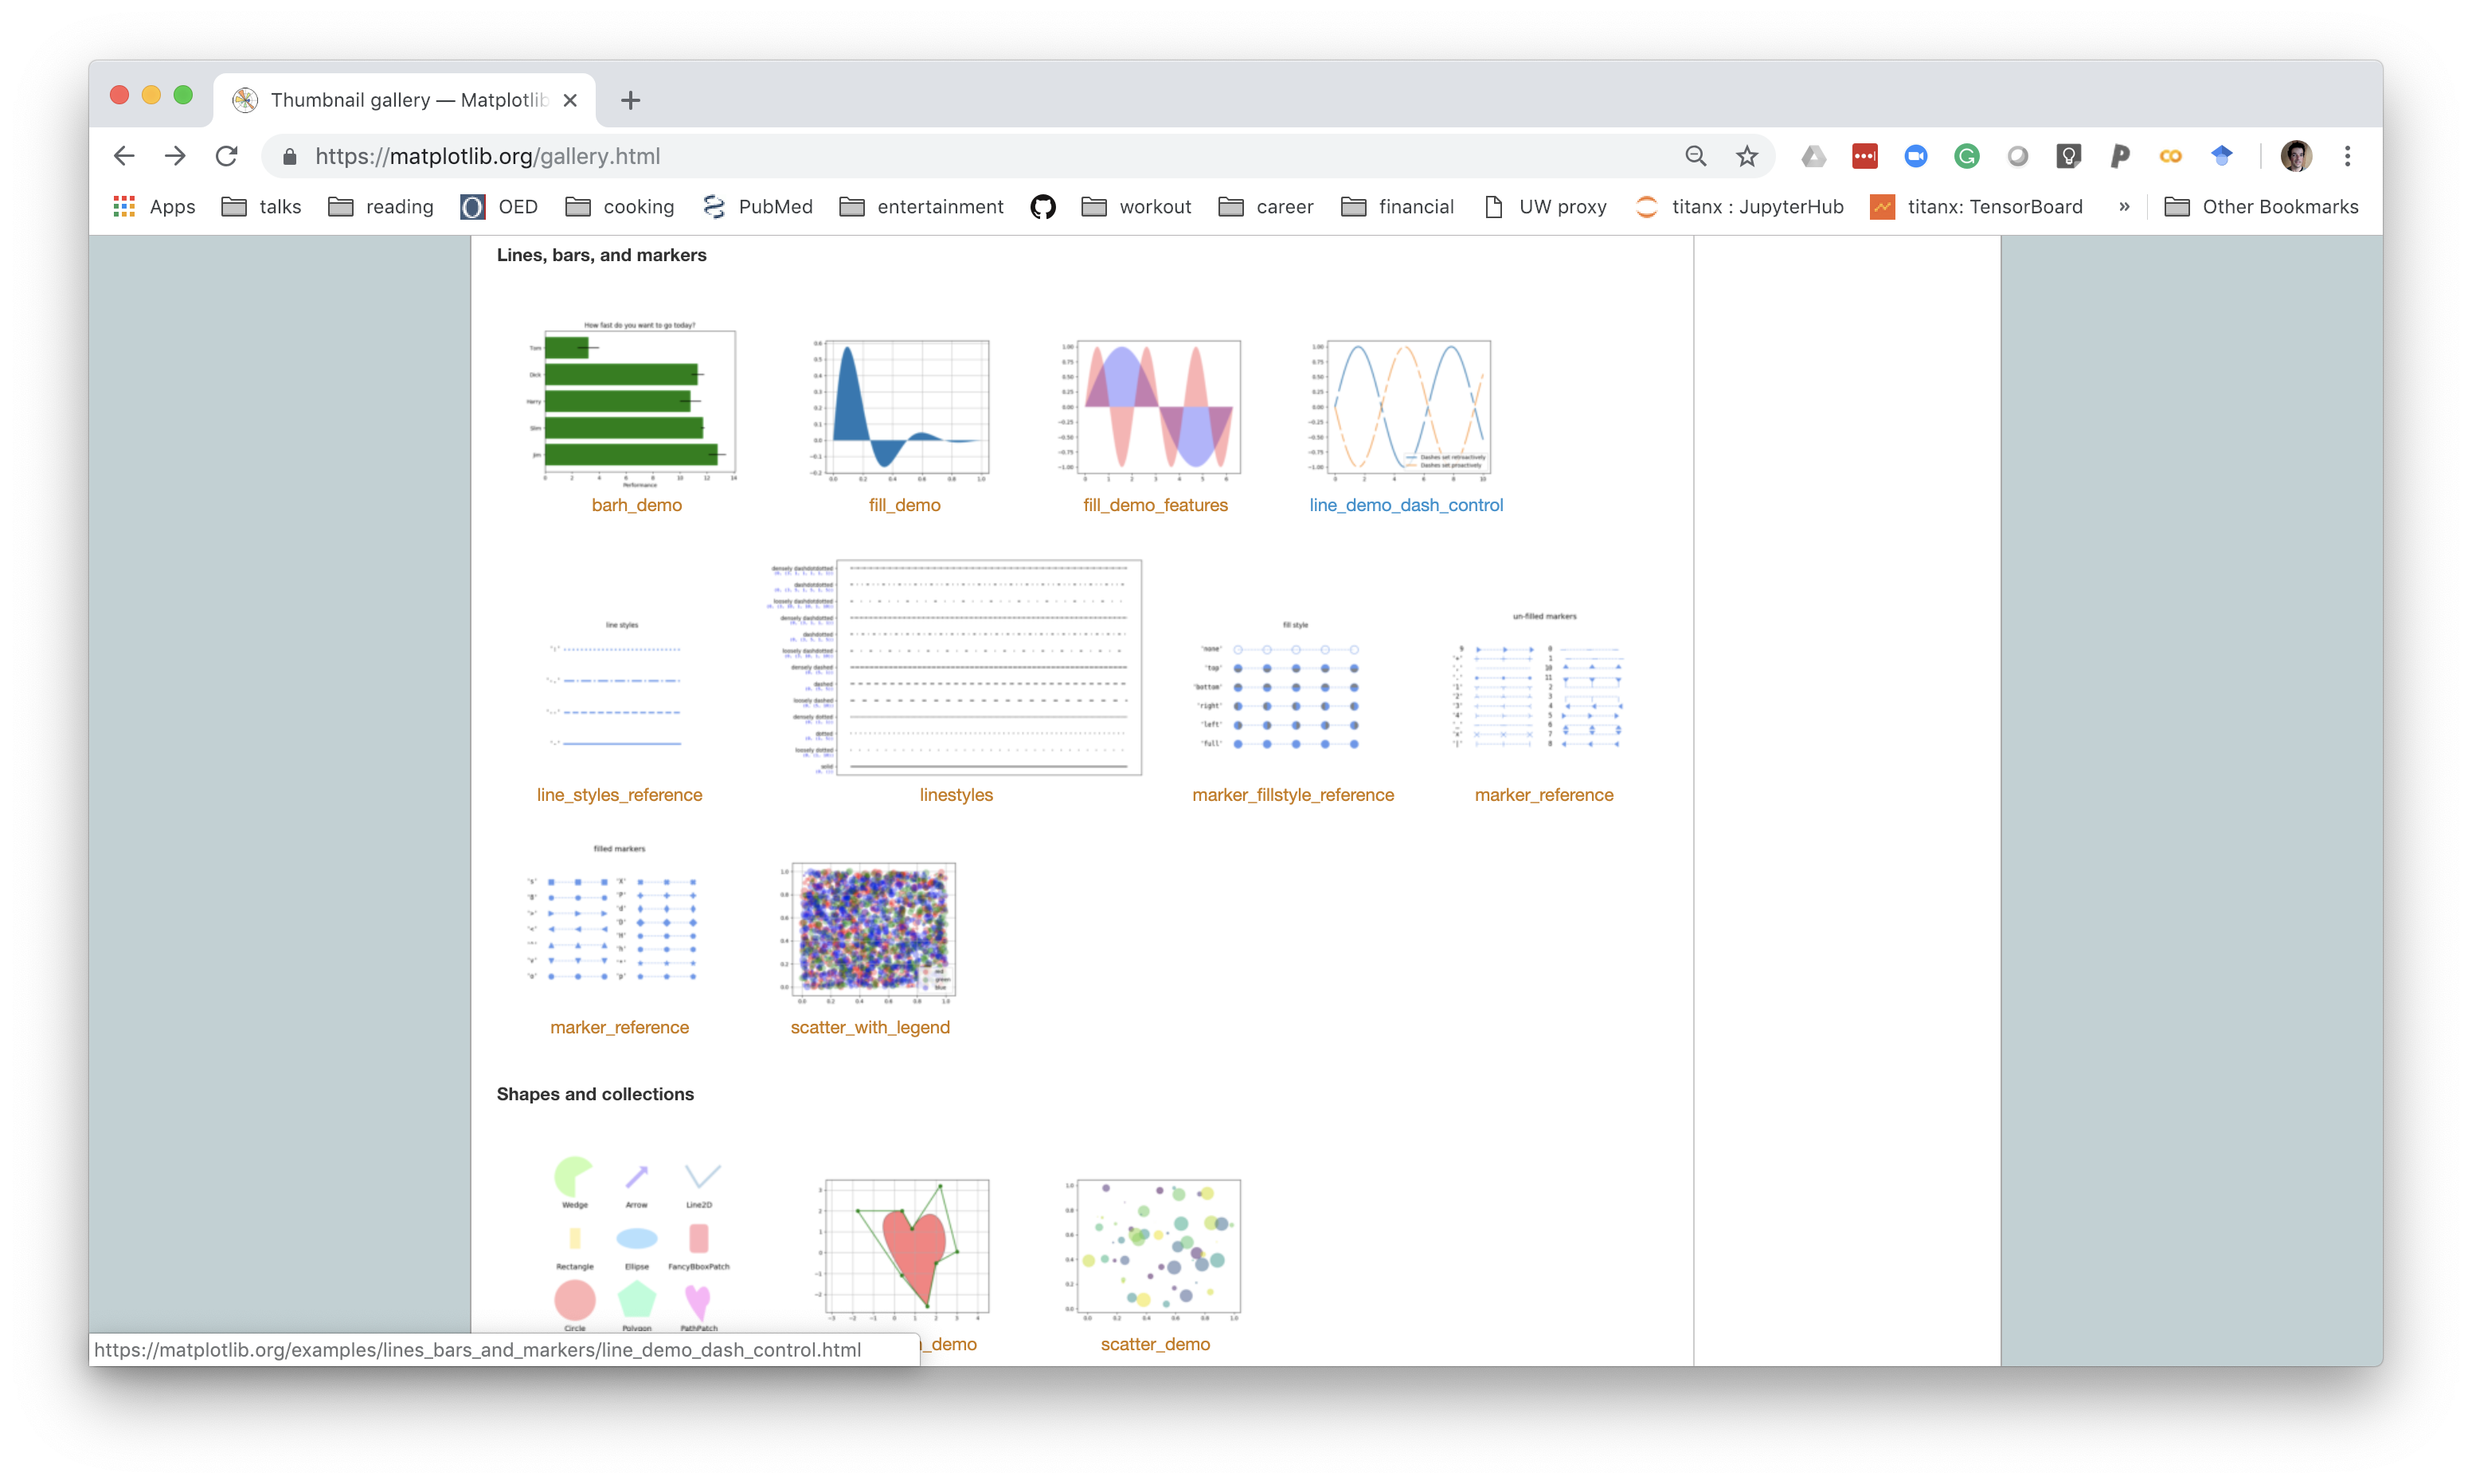
Example page with code
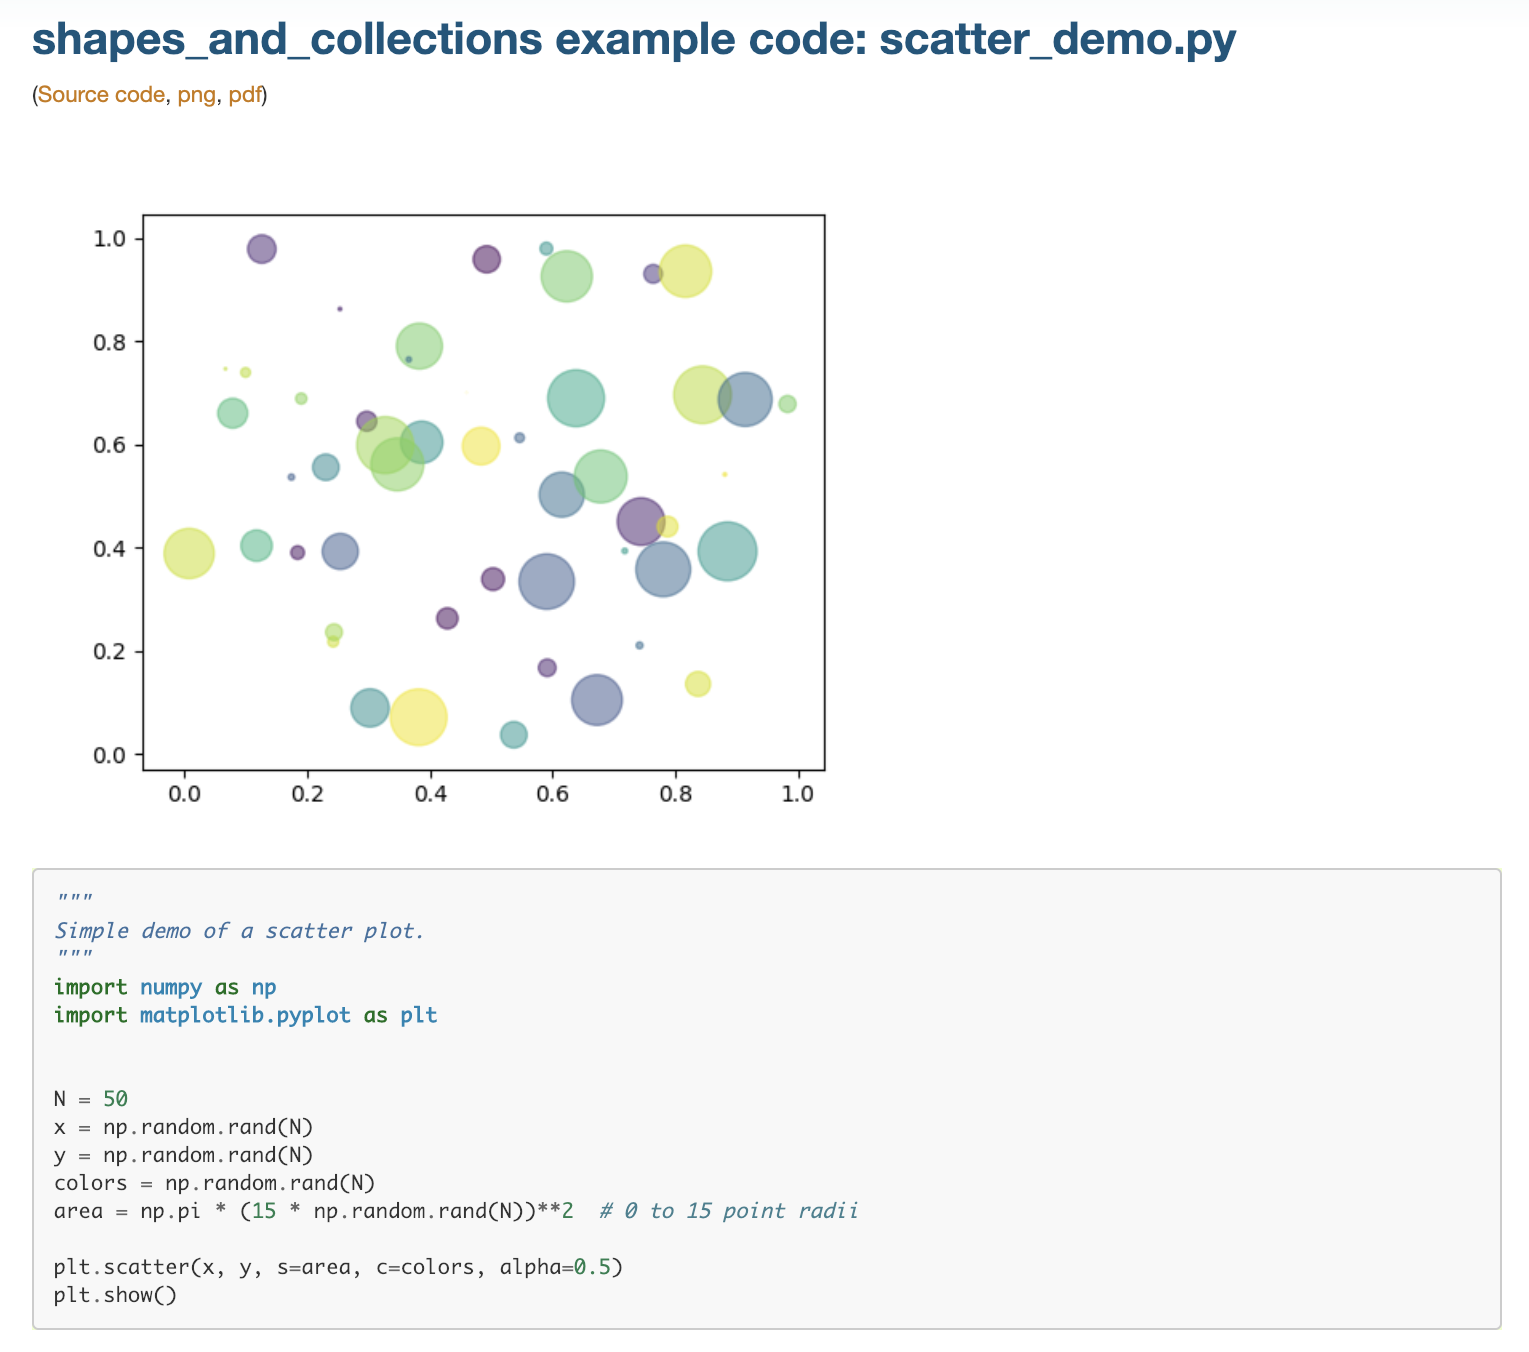
Plotting data in 3D
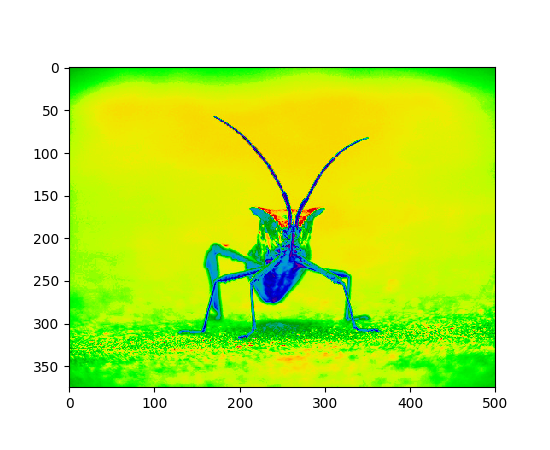
Visualizing images with pseudo-color
Animations
Using Matplotlib for geospatial data

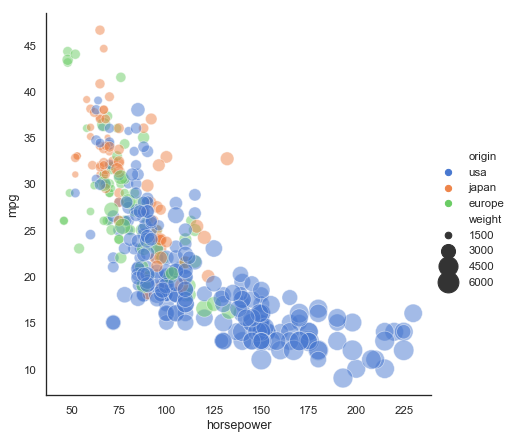
pandas + Matplotlib = Seaborn
seaborn.relplot(x="horsepower", y="mpg", hue="origin", size="weight",
                sizes=(40, 400), alpha=.5, palette="muted",
                height=6, data=mpg)