The United Nations Voting Dataset
Case Study: Exploratory Data Analysis in R

Dave Robinson
Chief Data Scientist, DataCamp
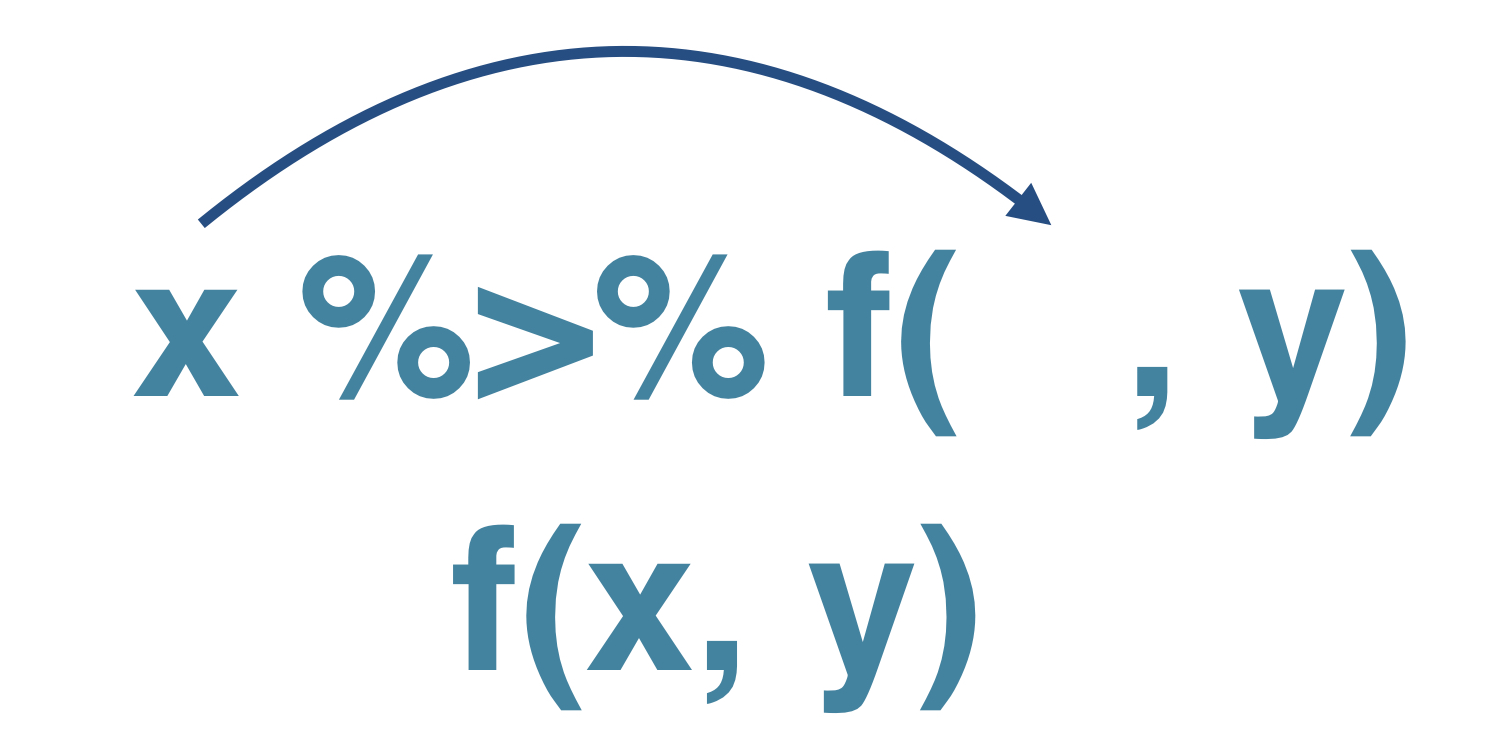
The pipe operator

The pipe operator
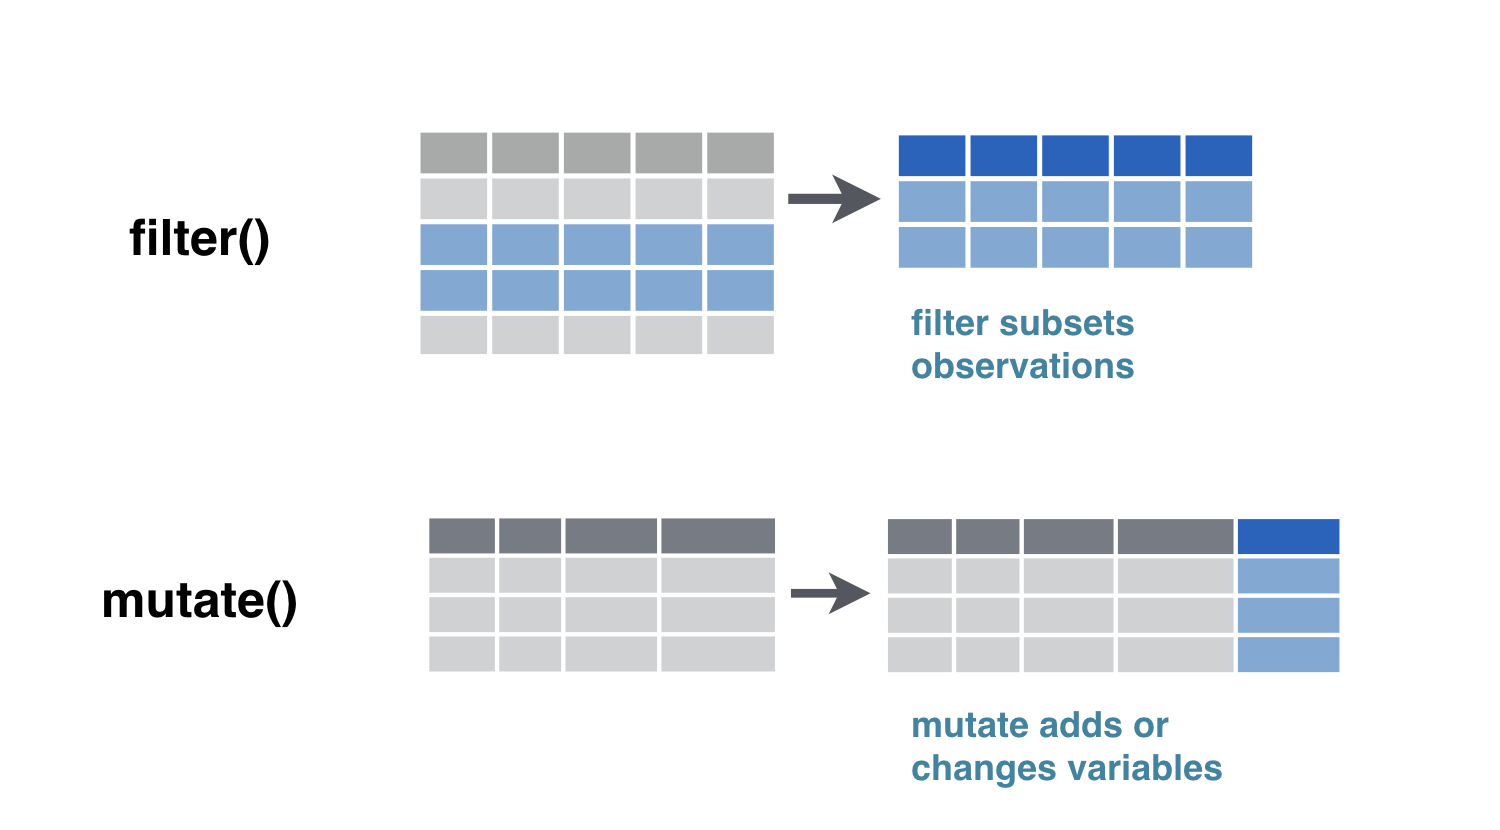
dplyr verbs
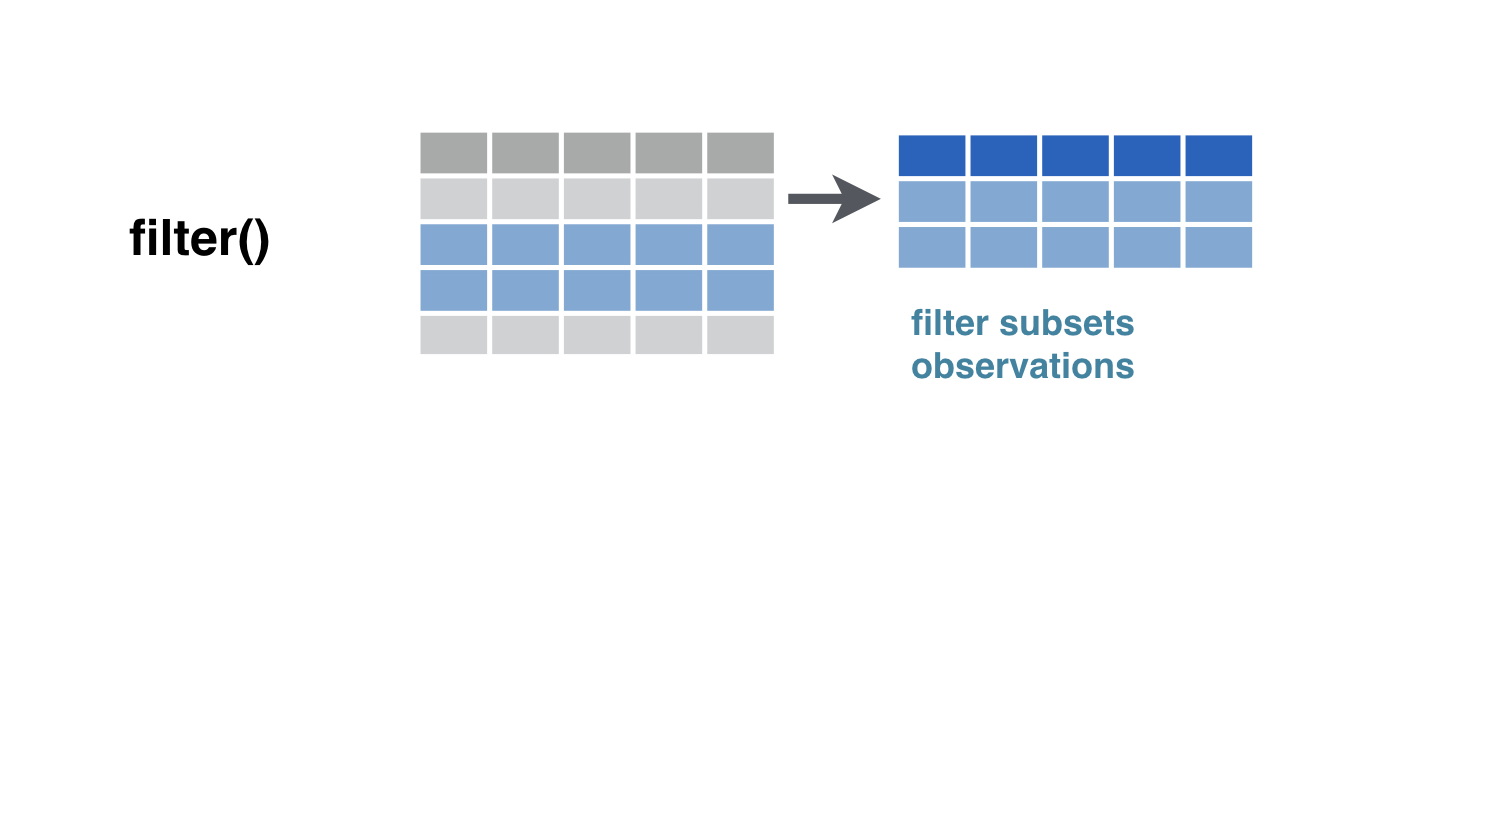
dplyr verbs
Chaining operations in data cleaning

Case Study: Exploratory Data Analysis in R
Dave Robinson
Chief Data Scientist, DataCamp

