Tidy modeling by topic and country
Case Study: Exploratory Data Analysis in R

Dave Robinson
Chief Data Scientist, DataCamp
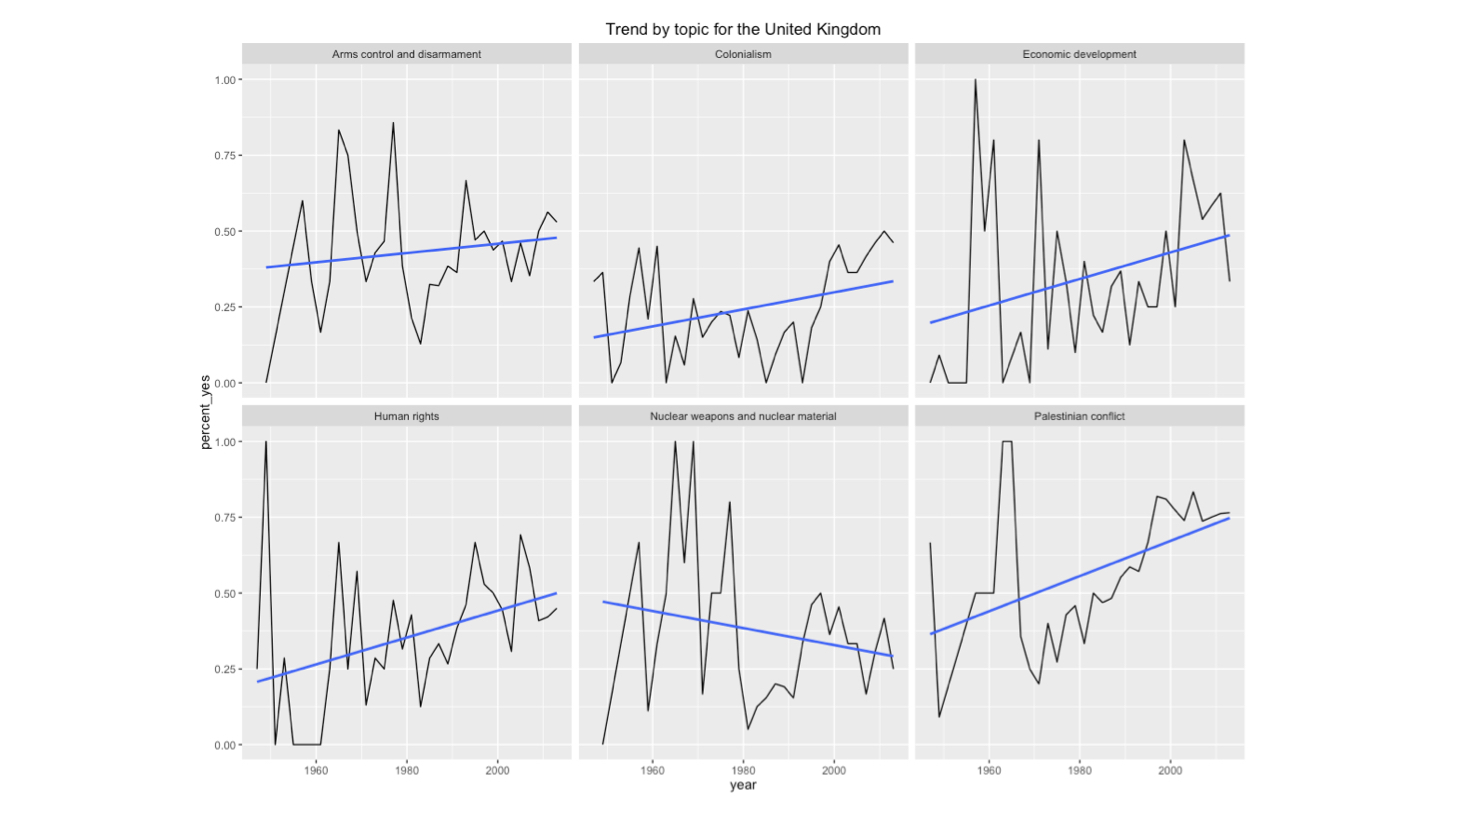
Detecting a trend by topic
Tidy modeling by country
library(tidyr)
library(purrr)
library(broom)
country_coefficients <- by_year_country %>%
  nest(-country) %>%
  mutate(model = map(data, ~ lm(percent_yes ~ year, data = .)),
         tidied = map(model, tidy)) %>%
  unnest(tidied)
country_coefficients
# A tibble: 399 × 6
       country        term      estimate    std.error statistic      p.value
         <chr>       <chr>         <dbl>        <dbl>     <dbl>        <dbl>
1  Afghanistan (Intercept) -11.063084650 1.4705189228 -7.523252 1.444892e-08
2  Afghanistan        year   0.006009299 0.0007426499  8.091698 3.064797e-09
3    Argentina (Intercept)  -9.464512565 2.1008982371 -4.504984 8.322481e-05
4    Argentina        year   0.005148829 0.0010610076  4.852773 3.047078e-05
5    Australia (Intercept)  -4.545492536 2.1479916283 -2.116159 4.220387e-02
# ... with 394 more rows
Tidy modeling by country and topic
library(purrr)
library(broom)
country_topic_coefficients <- by_year_country_topic %>%
  nest(-country, -topic) %>%
  mutate(model = map(data, ~ lm(percent_yes ~ year, data = .)),
         tidied = map(model, tidy)) %>%
  unnest(tidied)
# A tibble: 2,383 × 7
       country                        topic        term      estimate    std.error
         <chr>                        <chr>       <chr>         <dbl>        <dbl>
1  Afghanistan                  Colonialism (Intercept)  -9.196506325 1.9573746777
2  Afghanistan                  Colonialism        year   0.005106200 0.0009885245
3  Afghanistan         Economic development (Intercept) -11.476390441 3.6191205187
4  Afghanistan         Economic development        year   0.006239157 0.0018265400
5  Afghanistan                 Human rights (Intercept)  -7.265379964 4.3740212201
6  Afghanistan                 Human rights        year   0.004075877 0.0022089932
7  Afghanistan         Palestinian conflict (Intercept) -13.313363338 3.5707983095
8  Afghanistan         Palestinian conflict        year   0.007167675 0.0018002649
9  Afghanistan Arms control and disarmament (Intercept) -13.759624843 4.1328667932
10 Afghanistan Arms control and disarmament        year   0.007369733 0.0020837753
# ... with 2,373 more rows, and 2 more variables: statistic <dbl>, p.value <dbl>
Tidy modeling by country and topic
library(purrr)
library(broom)
country_topic_coefficients <- by_year_country_topic %>%
  nest(-country, -topic) %>%
  mutate(model = map(data, ~ lm(percent_yes ~ year, data = .)),
         tidied = map(model, tidy)) %>%
  unnest(tidied)
# A tibble: 2,383 × 7
       country                        topic        term      estimate    std.error
         <chr>                        <chr>       <chr>         <dbl>        <dbl>
1  Afghanistan                  Colonialism (Intercept)  -9.196506325 1.9573746777
2  Afghanistan                  Colonialism        year   0.005106200 0.0009885245 <-
3  Afghanistan         Economic development (Intercept) -11.476390441 3.6191205187
4  Afghanistan         Economic development        year   0.006239157 0.0018265400 <-
5  Afghanistan                 Human rights (Intercept)  -7.265379964 4.3740212201
6  Afghanistan                 Human rights        year   0.004075877 0.0022089932 <-
7  Afghanistan         Palestinian conflict (Intercept) -13.313363338 3.5707983095
8  Afghanistan         Palestinian conflict        year   0.007167675 0.0018002649 <-
9  Afghanistan Arms control and disarmament (Intercept) -13.759624843 4.1328667932
10 Afghanistan Arms control and disarmament        year   0.007369733 0.0020837753 <-
# ... with 2,373 more rows, and 2 more variables: statistic <dbl>, p.value <dbl>
Let's practice!
Case Study: Exploratory Data Analysis in R

