Tidy data
Case Study: Exploratory Data Analysis in R

Dave Robinson
Chief Data Scientist, DataCamp
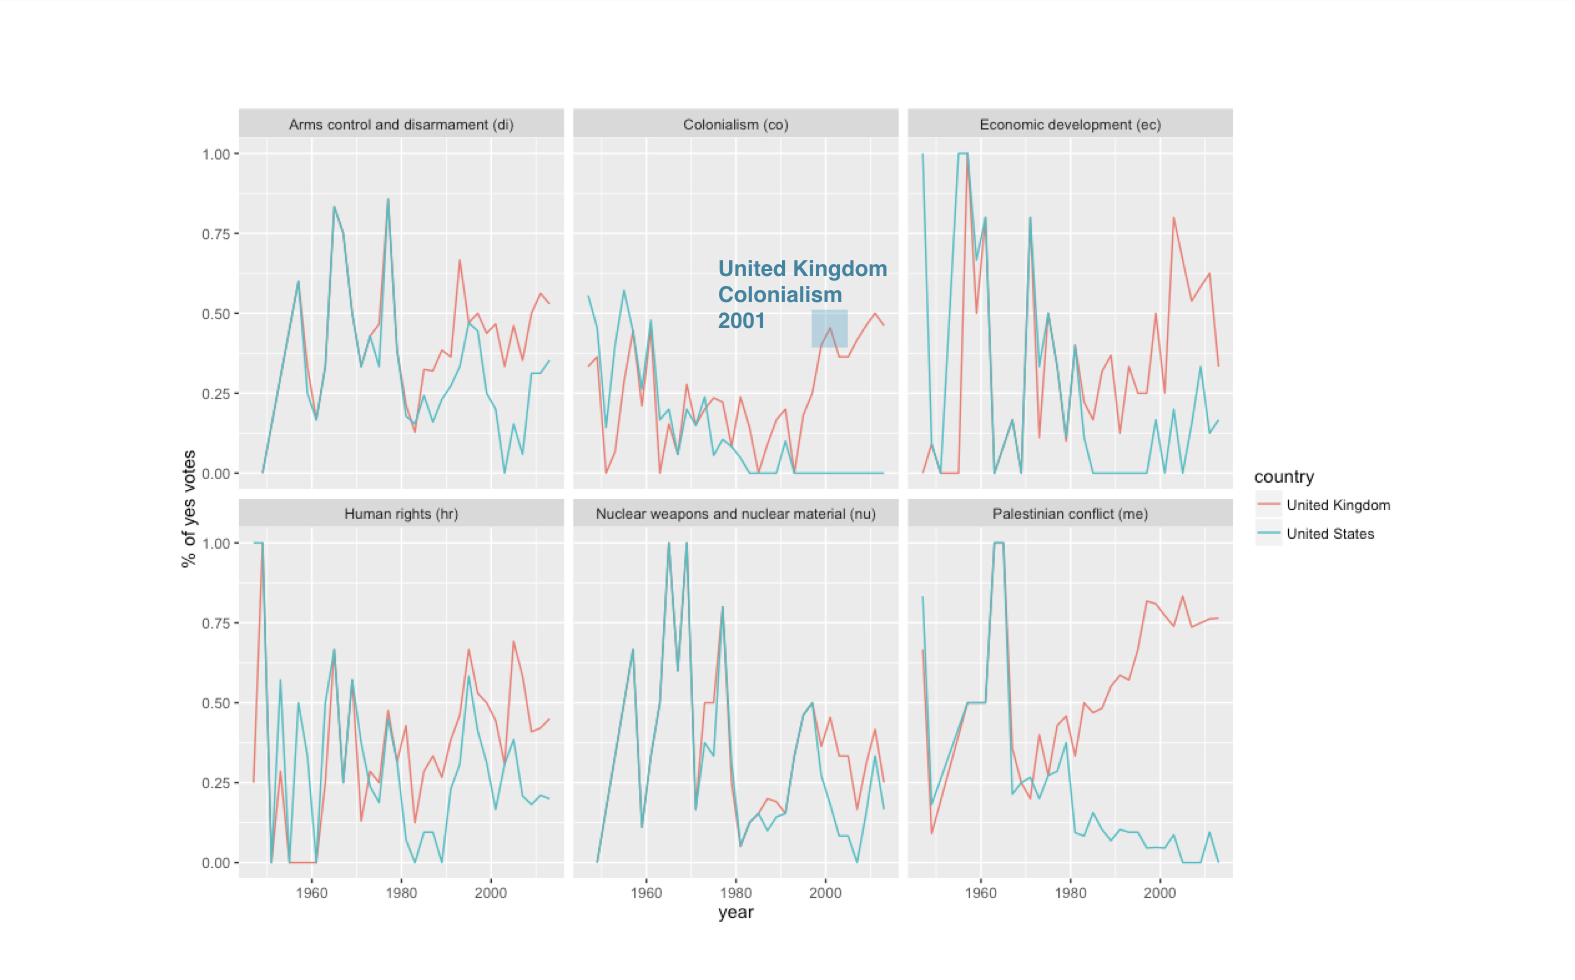
United Kingdom

United Kingdom
United Kingdom
United Kingdom
United Kingdom
United Kingdom
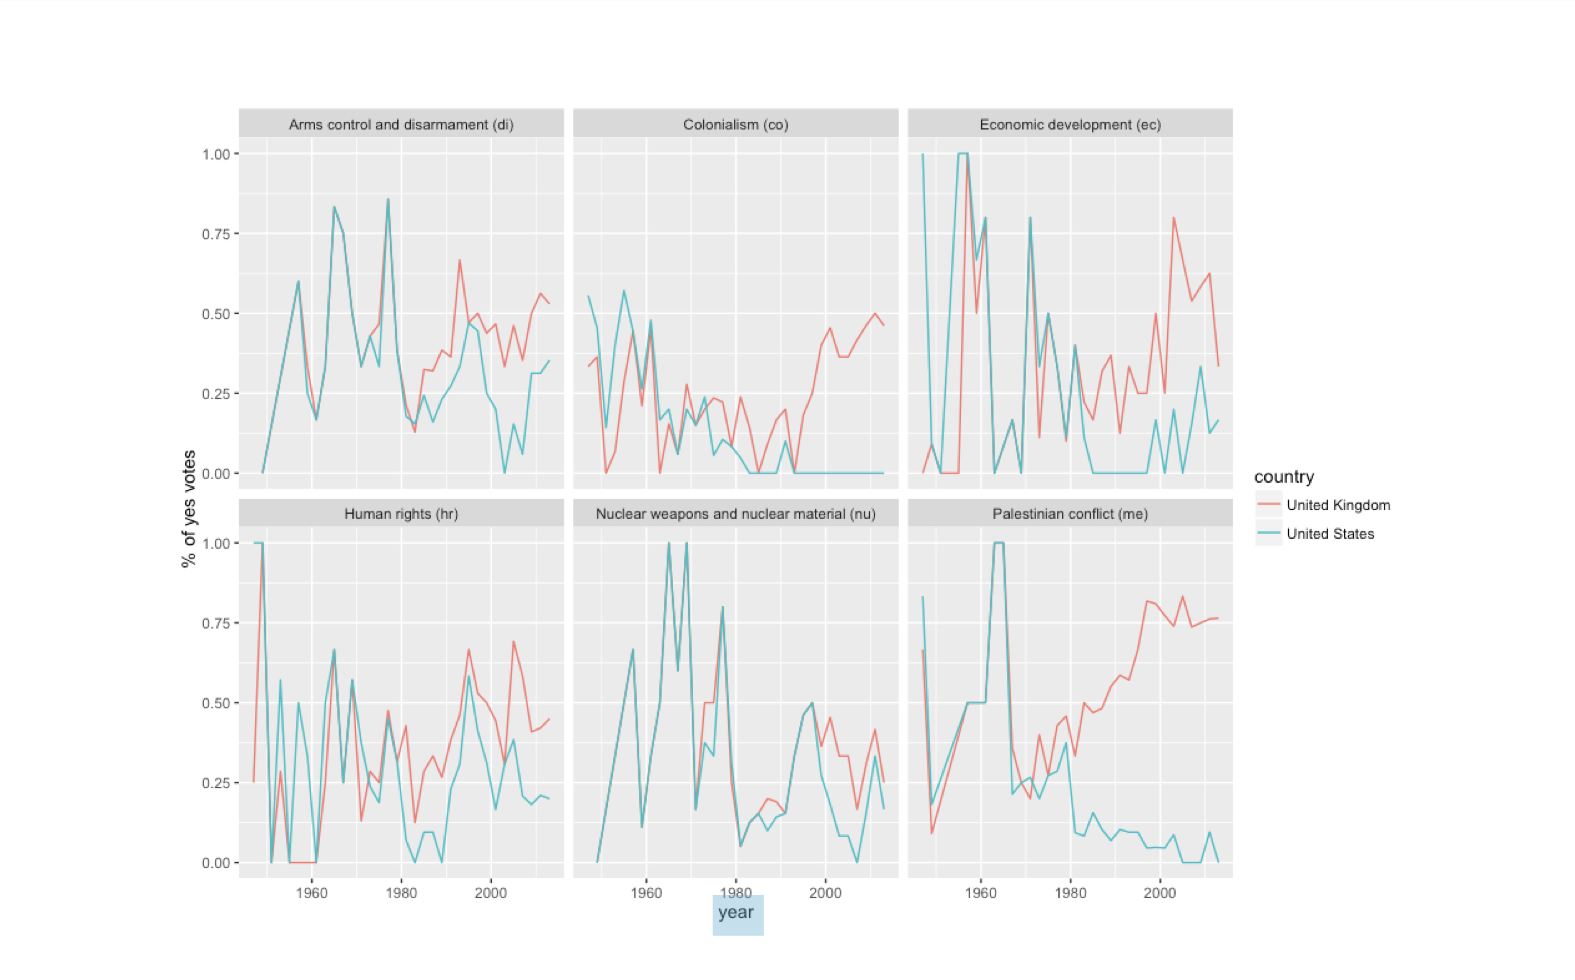
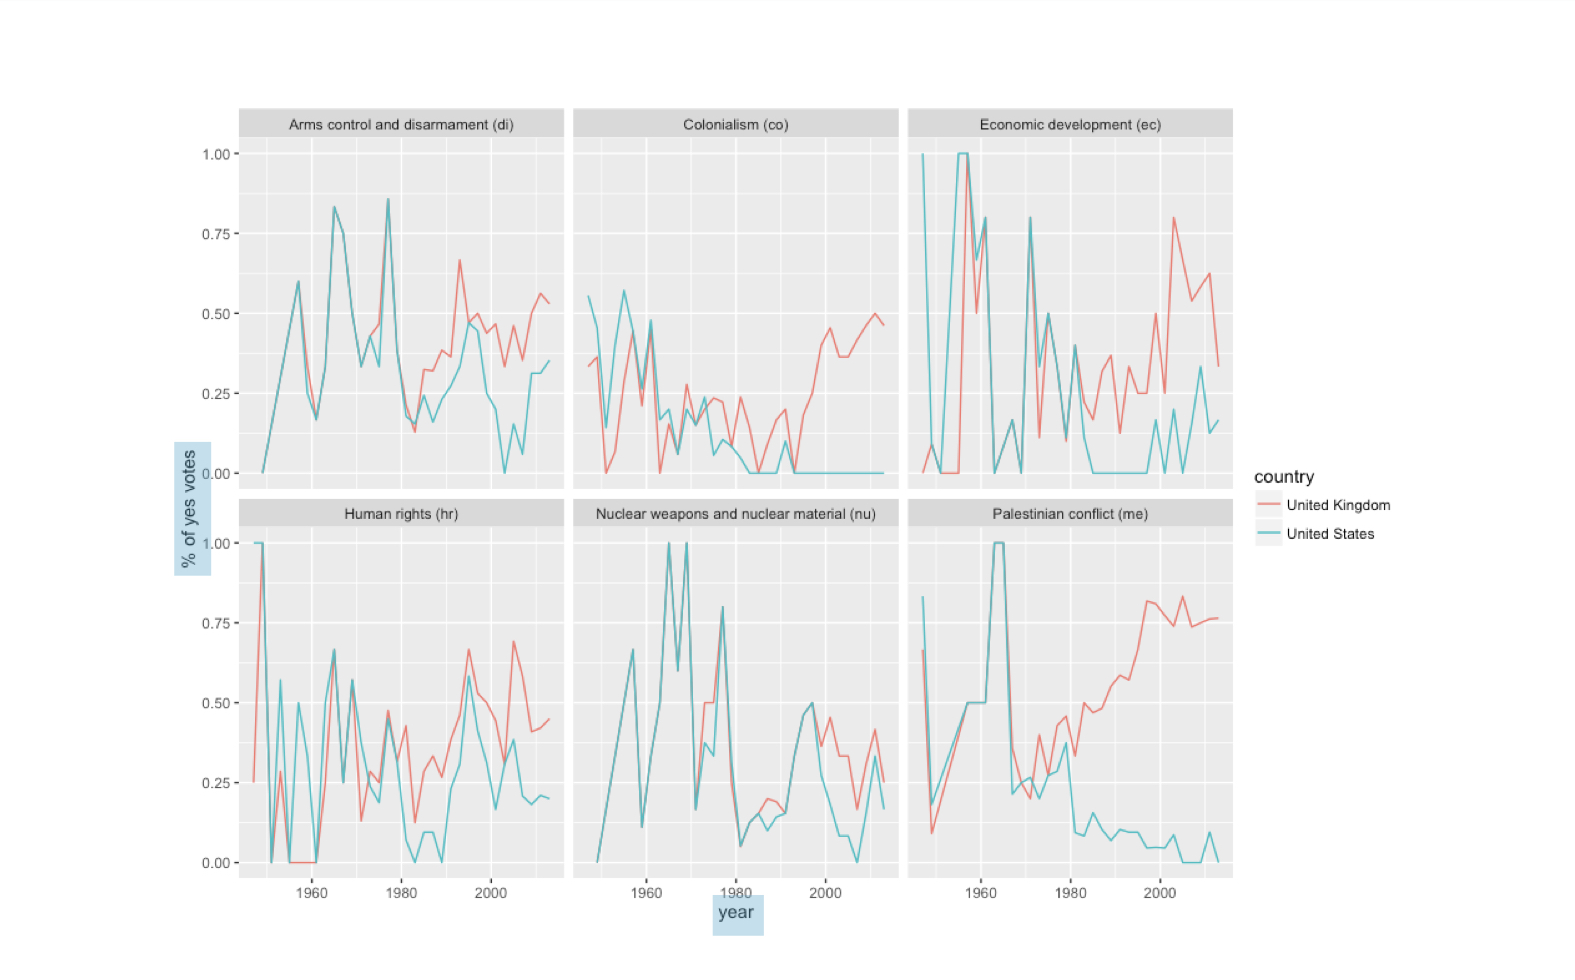
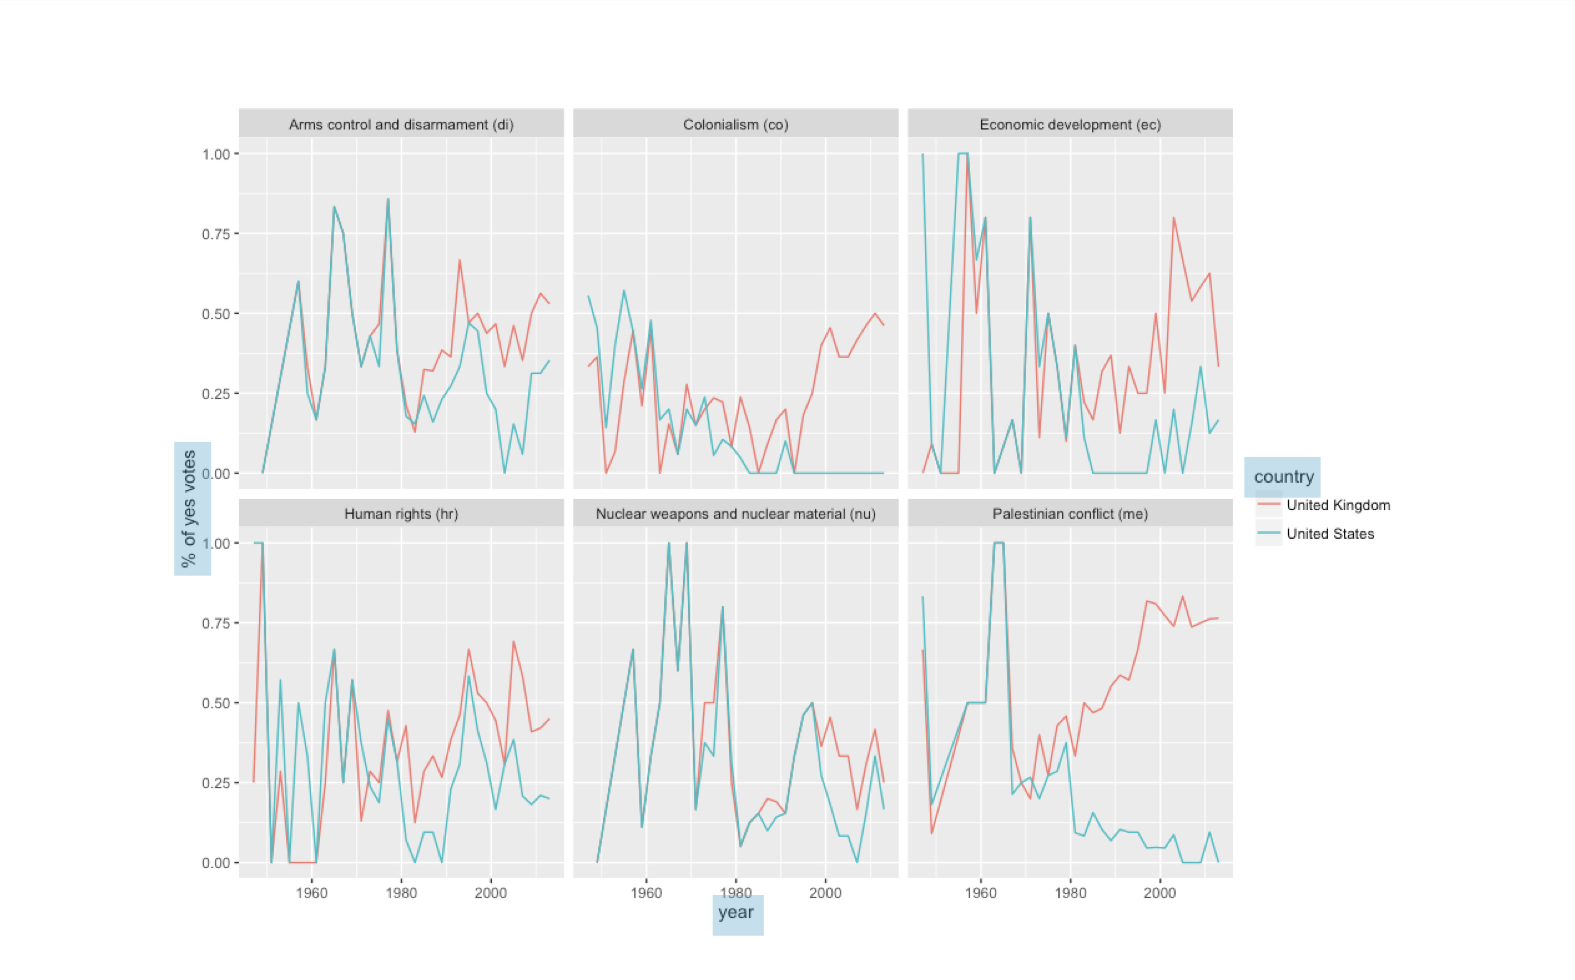
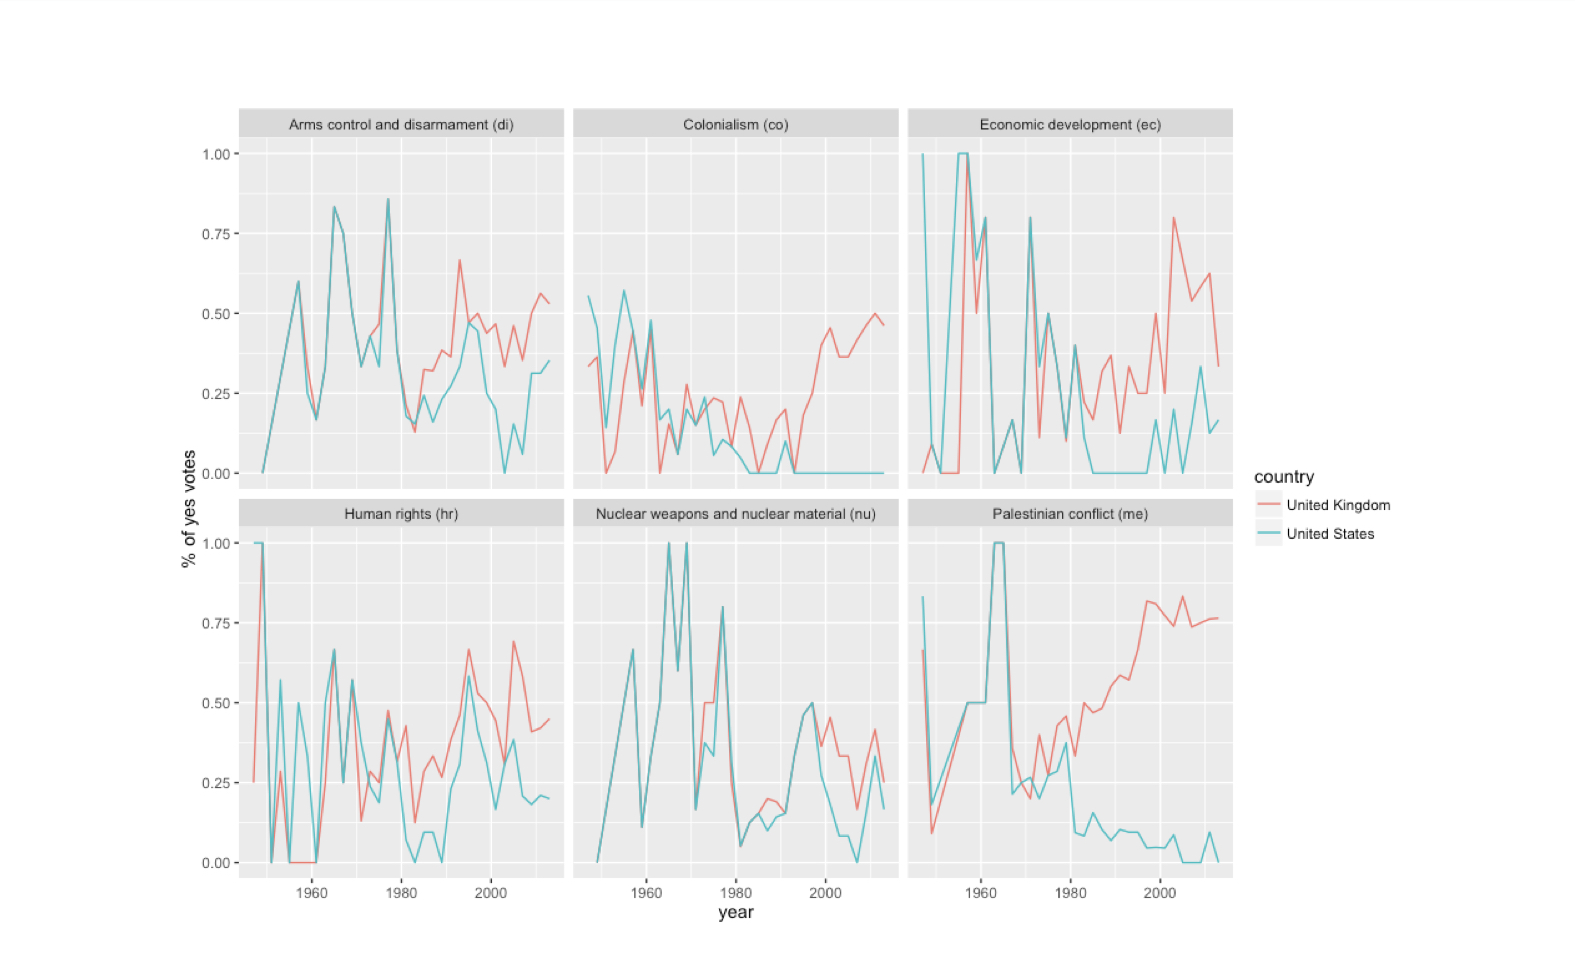
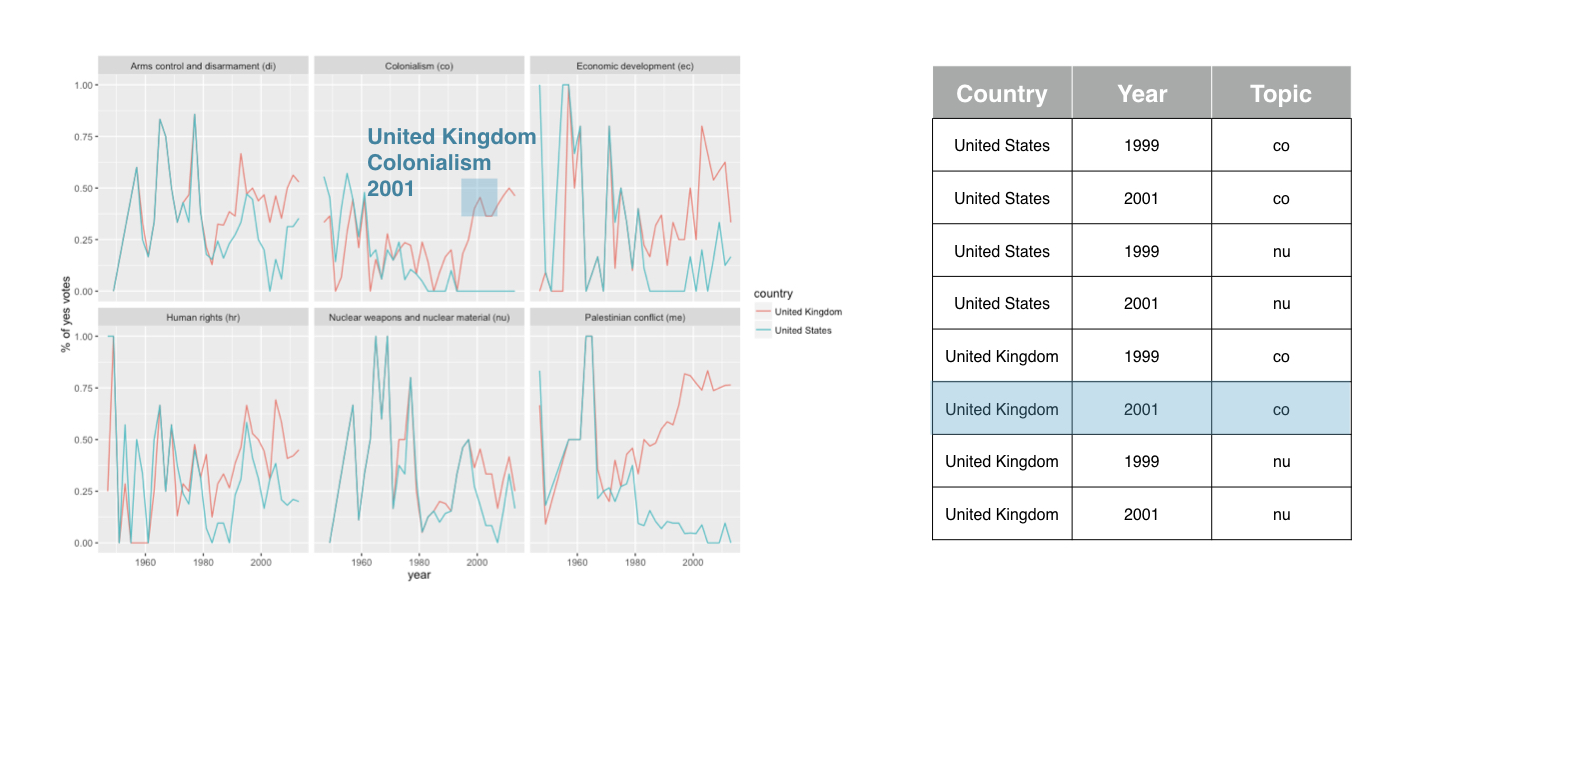
Tidy data: topic is a variable
Tidy data: topic is a variable
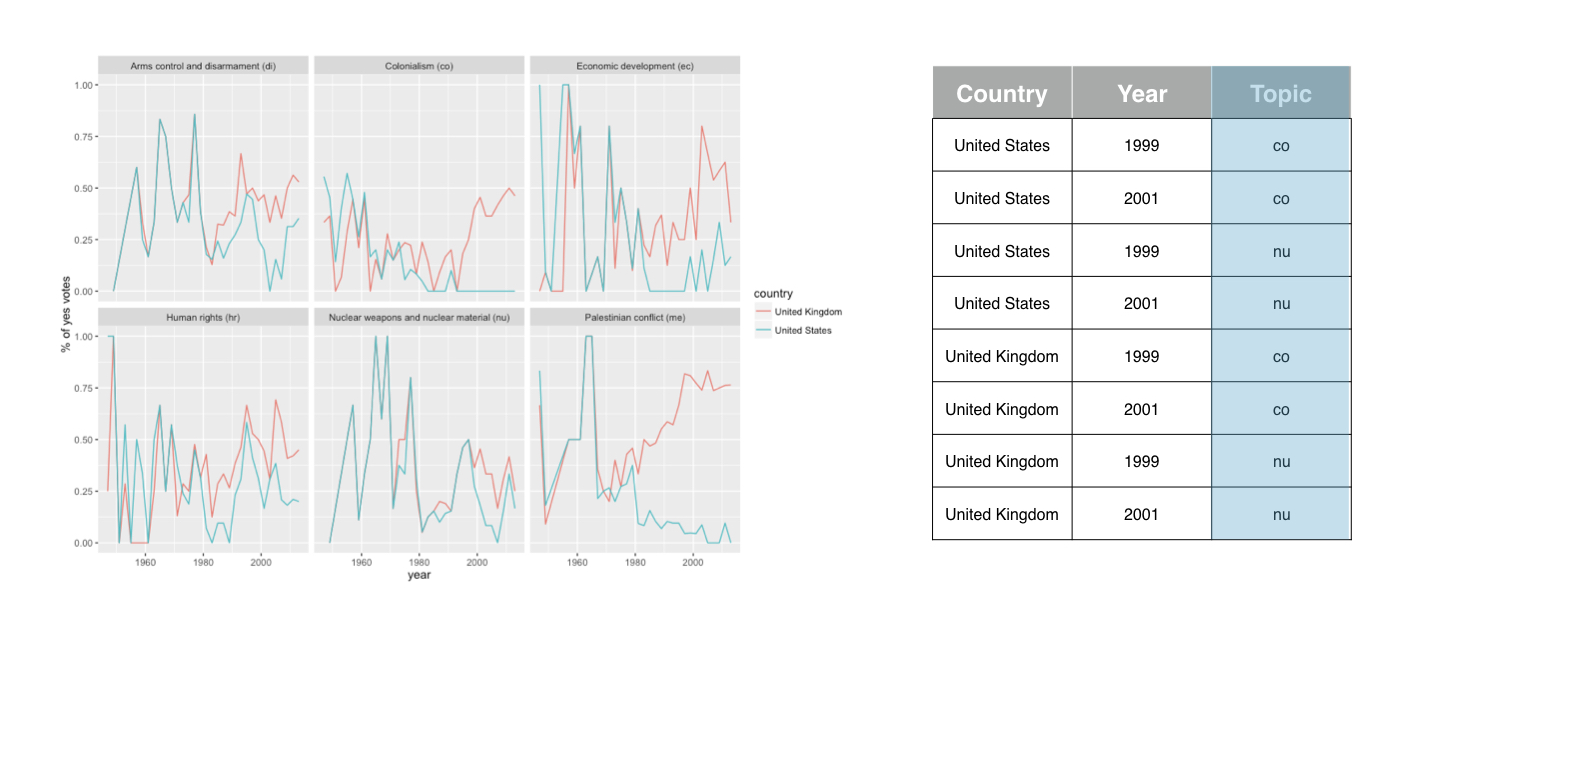
Tidy data: topic is a variable
Tidy data: topic is a variable
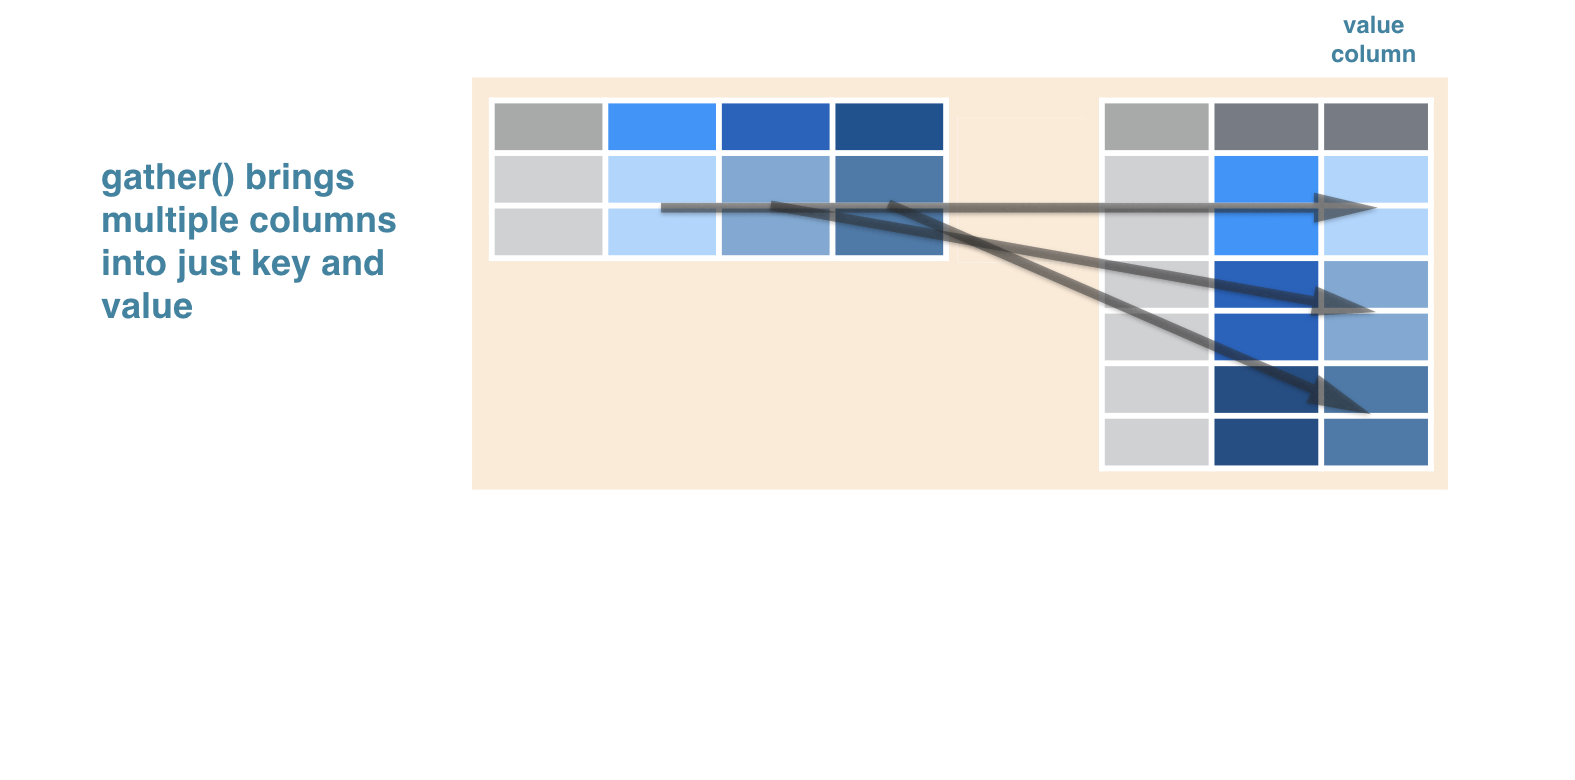
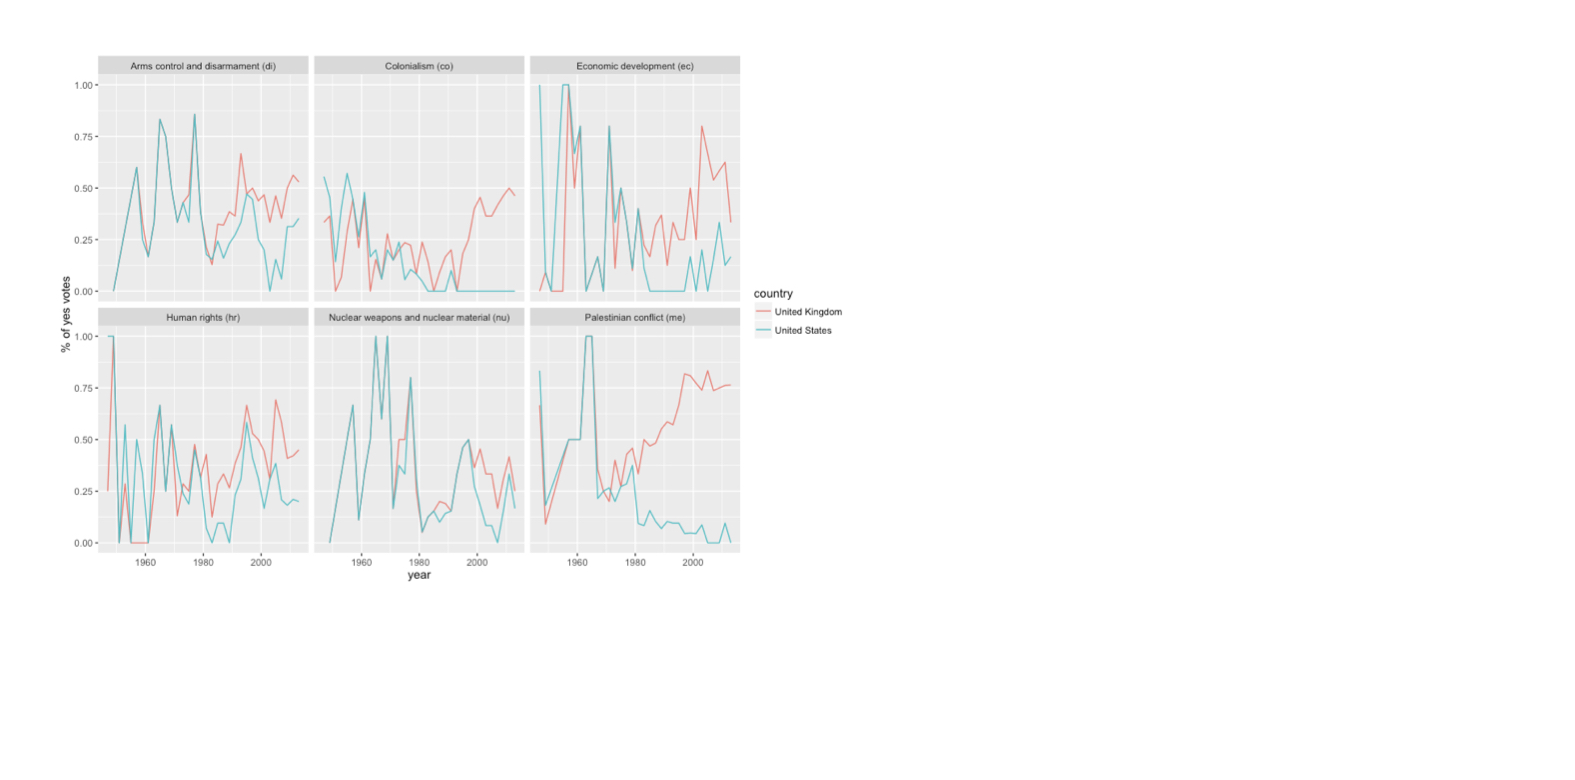
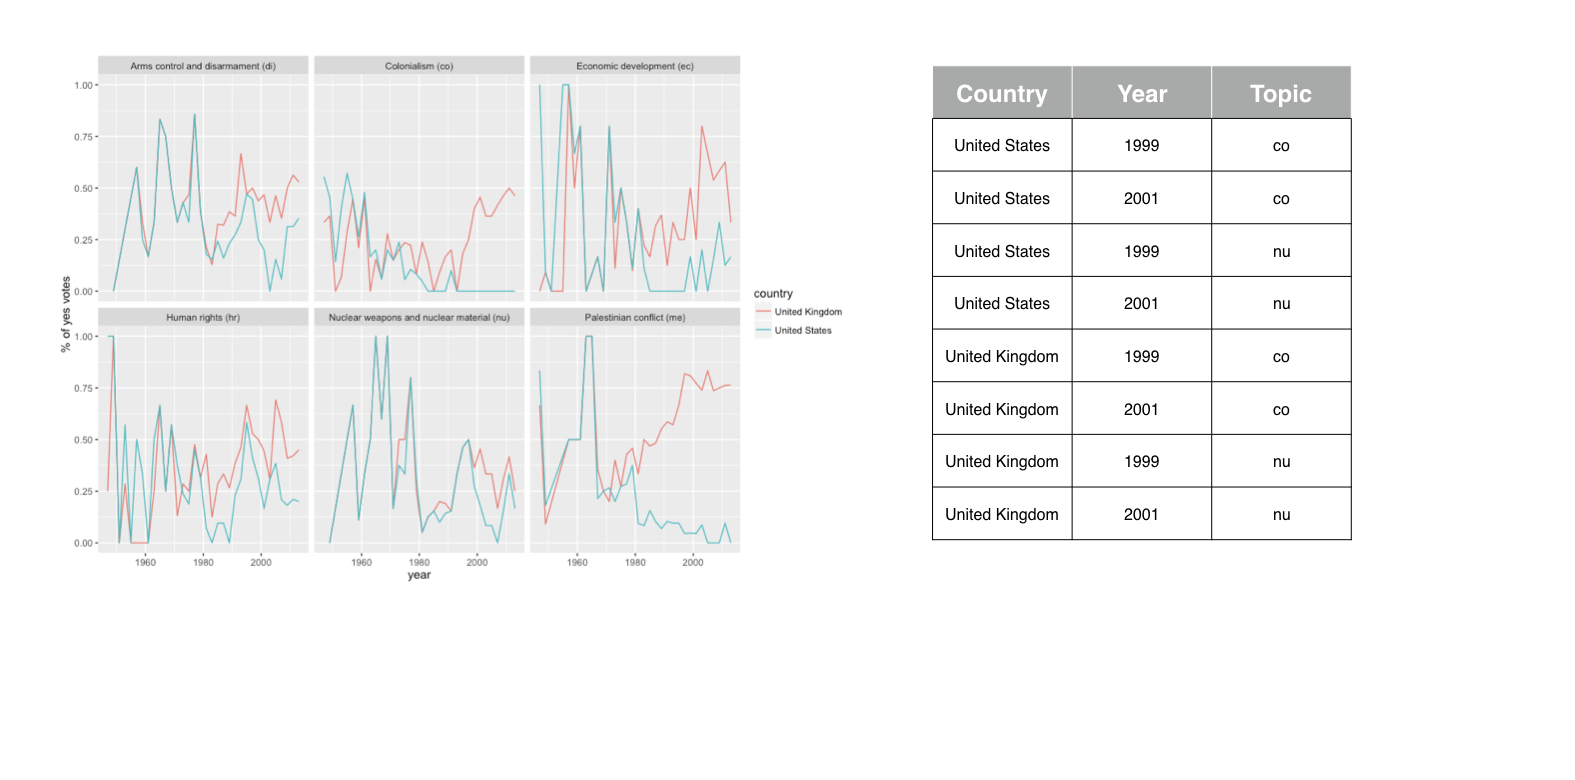
Use gather() to bring columns into two
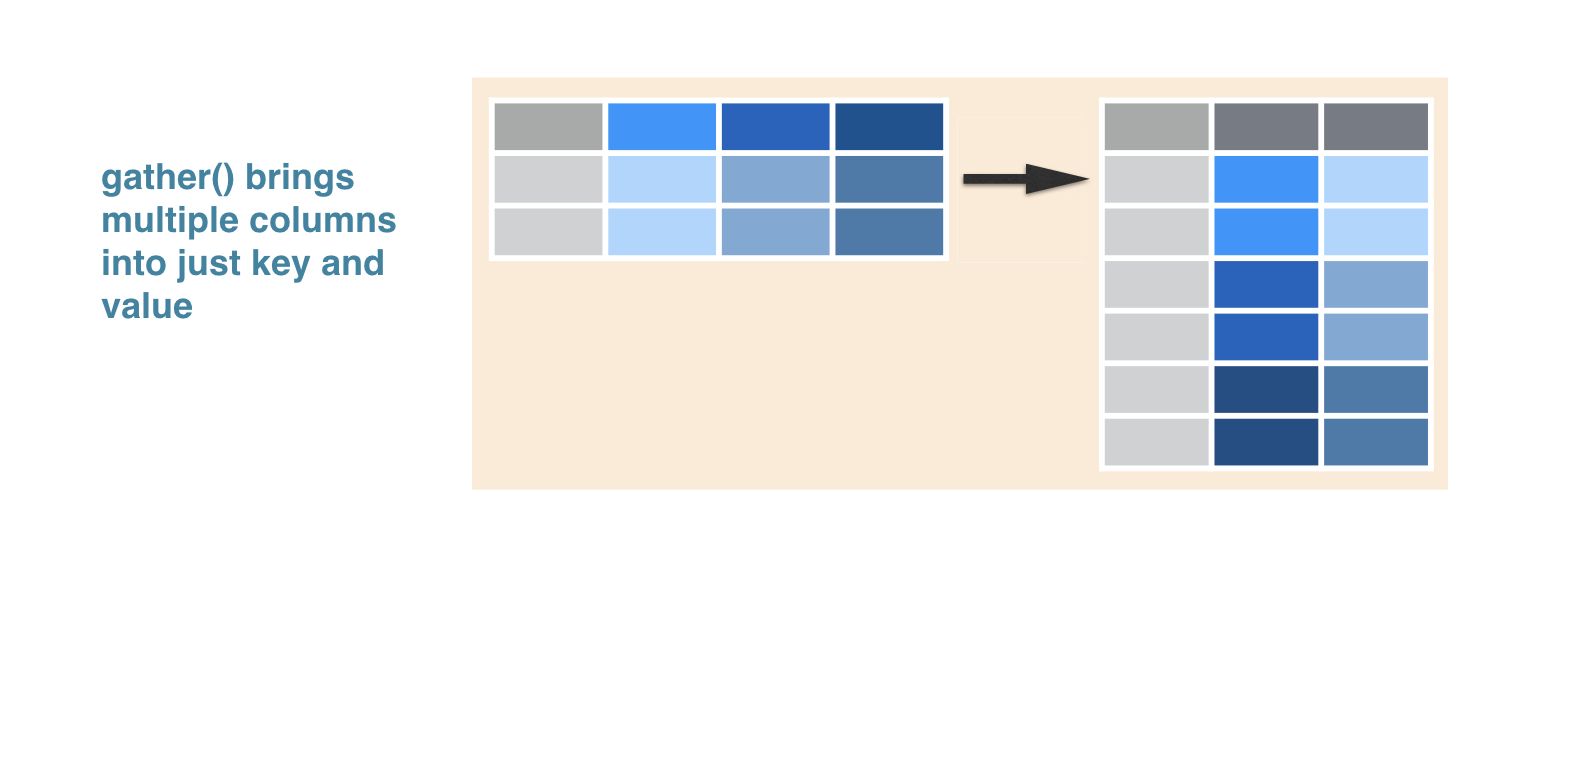
Use gather() to bring columns into two
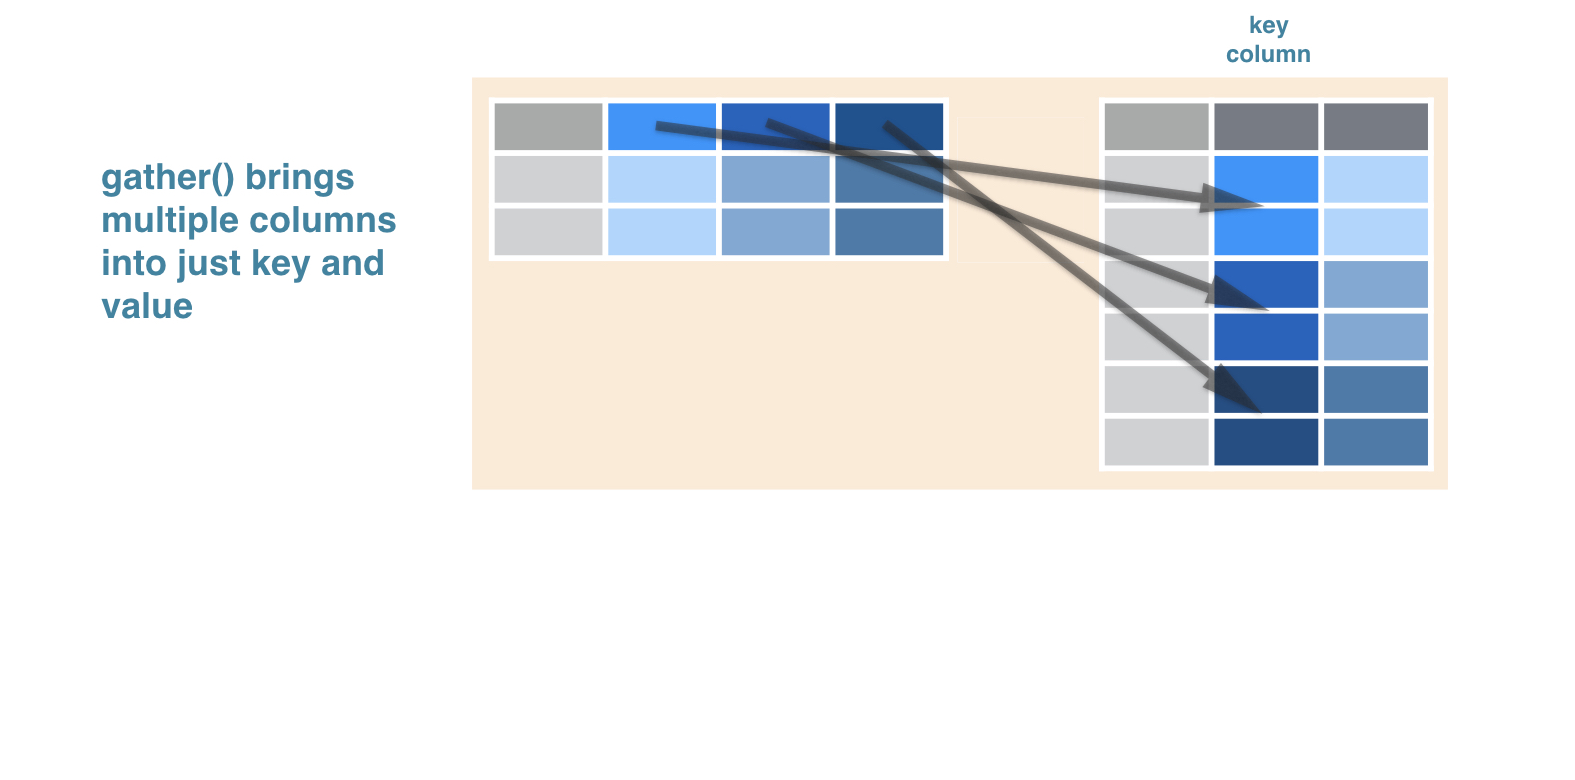
Use gather() to bring columns into two