Visualization with ggplot2
Case Study: Exploratory Data Analysis in R

Dave Robinson
Chief Data Scientist, DataCamp
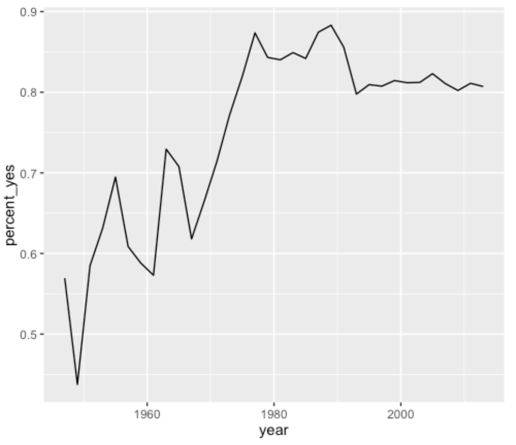
Visualizing by-year data
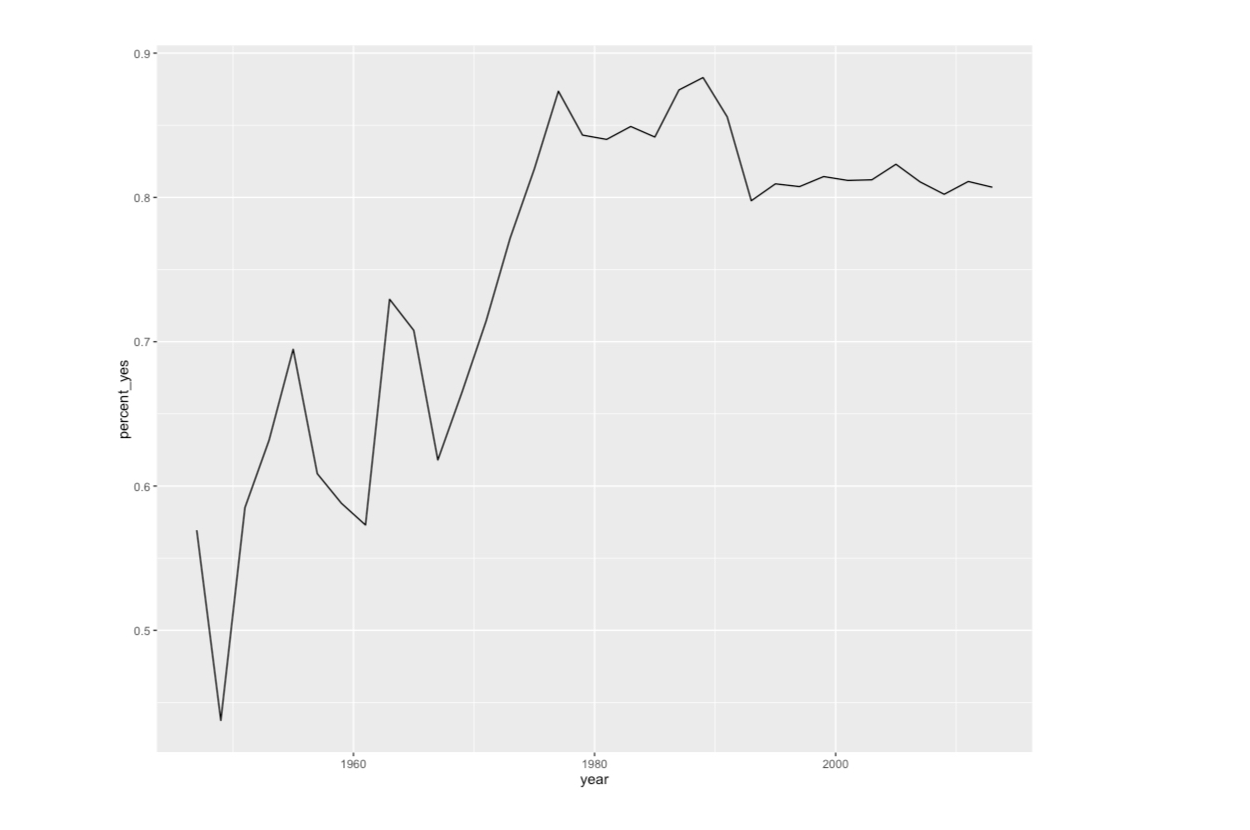
Visualizing by-year data
Case Study: Exploratory Data Analysis in R
Dave Robinson
Chief Data Scientist, DataCamp

