Grouping and summarizing

Case Study: Exploratory Data Analysis in R

Dave Robinson

Chief Data Scientist, DataCamp

Processed votes

votes_processed
# A tibble: 353,547 × 6
    rcid session  vote ccode  year            country
   <dbl>   <dbl> <dbl> <int> <dbl>              <chr>
1     46       2     1     2  1947      United States
2     46       2     1    20  1947             Canada
3     46       2     1    40  1947               Cuba
4     46       2     1    41  1947              Haiti
5     46       2     1    42  1947 Dominican Republic
6     46       2     1    70  1947             Mexico
7     46       2     1    90  1947          Guatemala
8     46       2     1    91  1947           Honduras
9     46       2     1    92  1947        El Salvador
10    46       2     1    93  1947          Nicaragua
# ... with 353,537 more rows
Case Study: Exploratory Data Analysis in R

Using “% of Yes votes” as a summary

1-2.004.png

Case Study: Exploratory Data Analysis in R

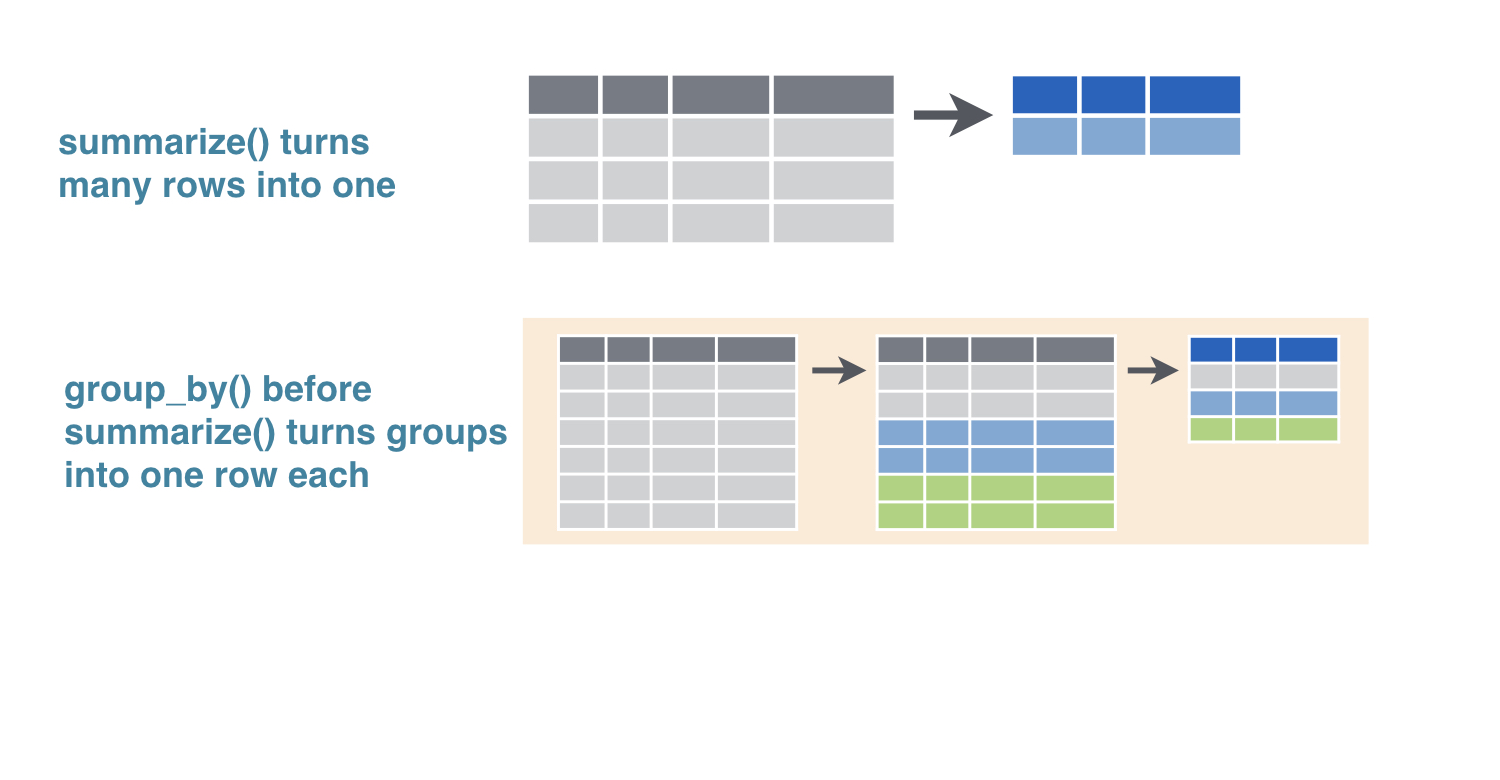
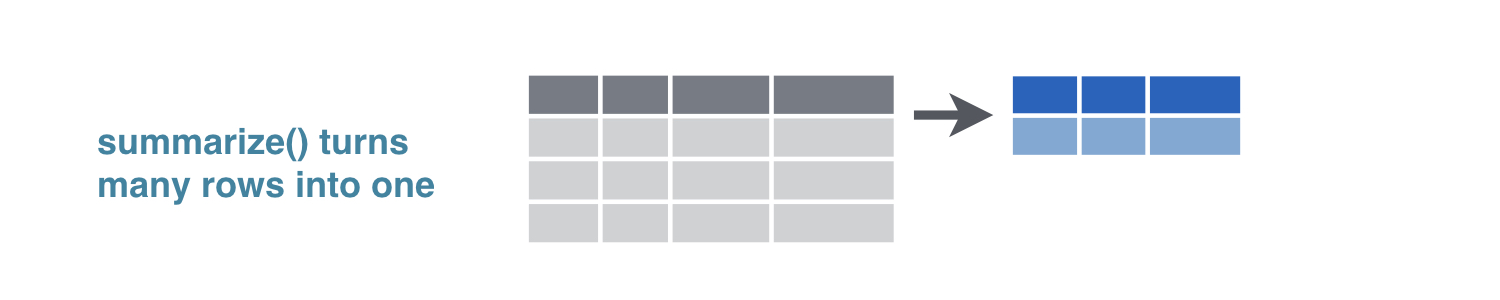
dplyr verb: summarize

summarize() turns many rows into one

1-2.005.png

Case Study: Exploratory Data Analysis in R

dplyr verbs: summarize

votes_processed %>%
  summarize(total = n())
# A tibble: 1 × 1
   total
   <int>
1 353547
Case Study: Exploratory Data Analysis in R

dplyr verbs: summarize

votes_processed %>%
  summarize(total = n(),
              percent_yes = mean(vote == 1))
# A tibble: 1 × 2
   total percent_yes
   <int>       <dbl>
1 353547   0.7999248
  • mean(vote == 1) is a way of calculating “percent of vote equal to 1”
Case Study: Exploratory Data Analysis in R

dplyr verb: group_by

  • summarize() turns many rows into one

  • group_by() before summarize() turns groups into one row each

1-2.014.png

Case Study: Exploratory Data Analysis in R

dplyr verbs: group_by

votes_processed %>%
  group_by(year) %>%
  summarize(total = n(),
              percent_yes = mean(vote == 1))
# A tibble: 34 × 3
    year total percent_yes
   <dbl> <int>       <dbl>
1   1947  2039   0.5693968
2   1949  3469   0.4375901
3   1951  1434   0.5850767
4   1953  1537   0.6317502
5   1955  2169   0.6947902
6   1957  2708   0.6085672
7   1959  4326   0.5880721
8   1961  7482   0.5729751
9   1963  3308   0.7294438
10  1965  4382   0.7078959
# ... with 24 more rows
Case Study: Exploratory Data Analysis in R

Let's practice!

Case Study: Exploratory Data Analysis in R

Preparing Video For Download...