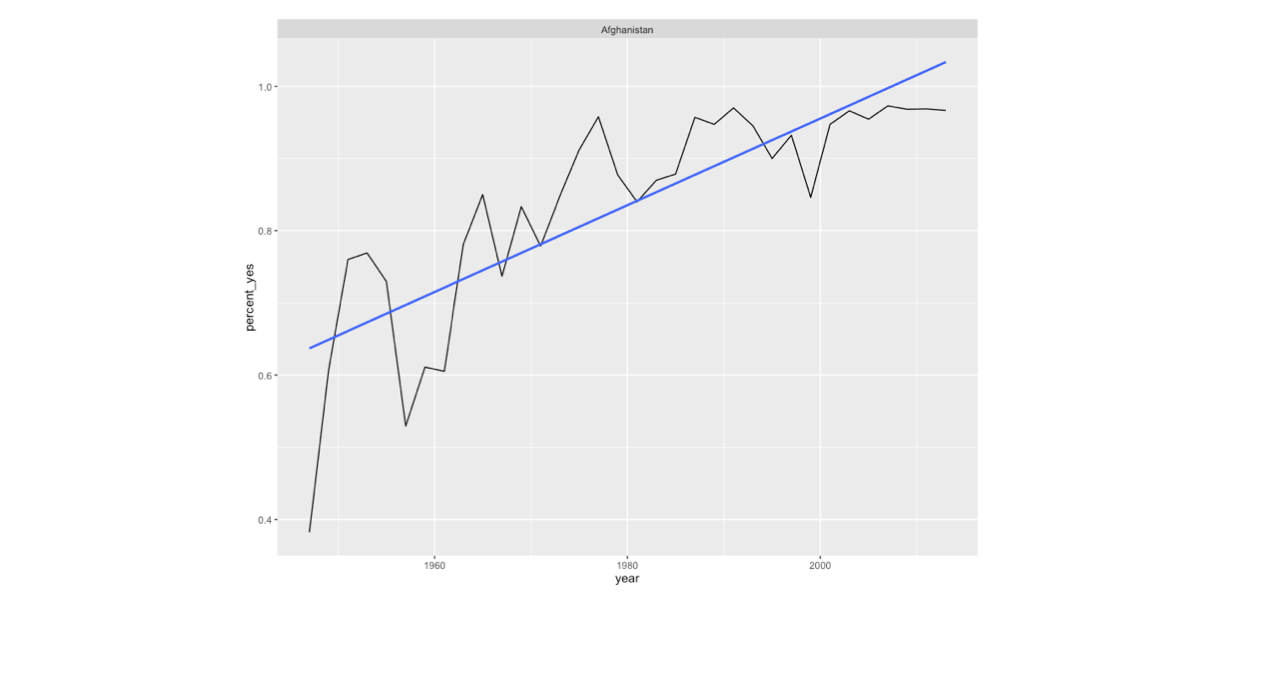
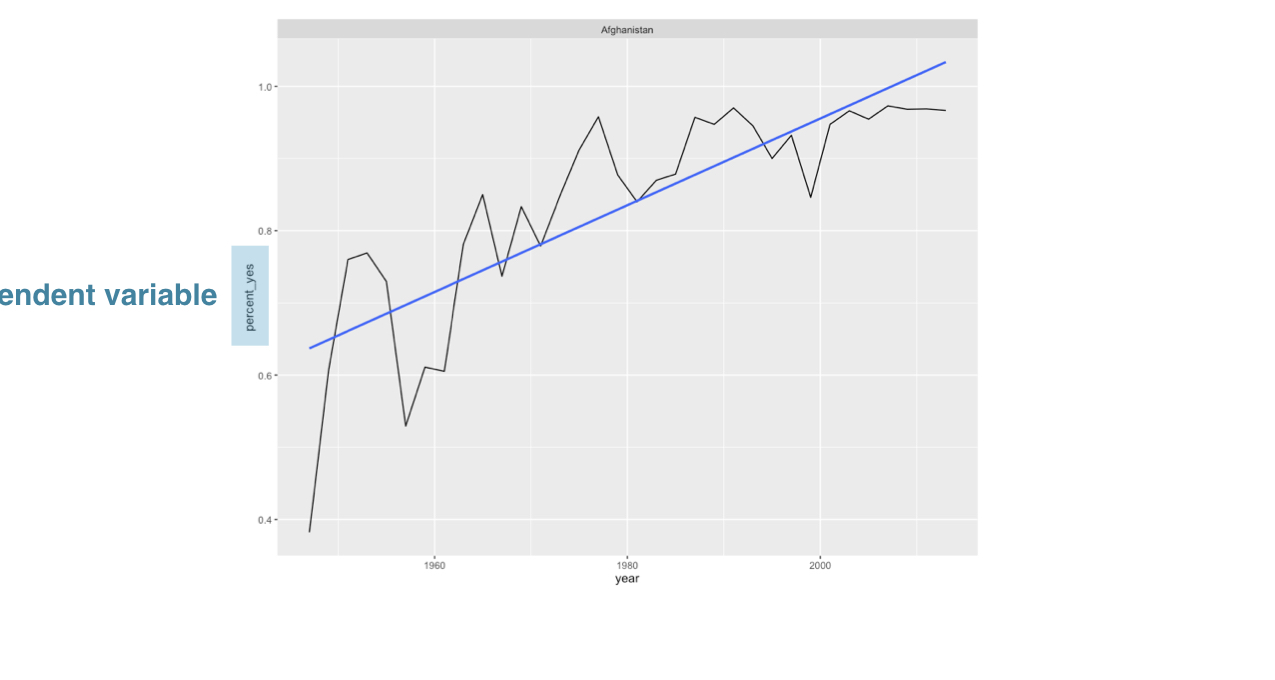
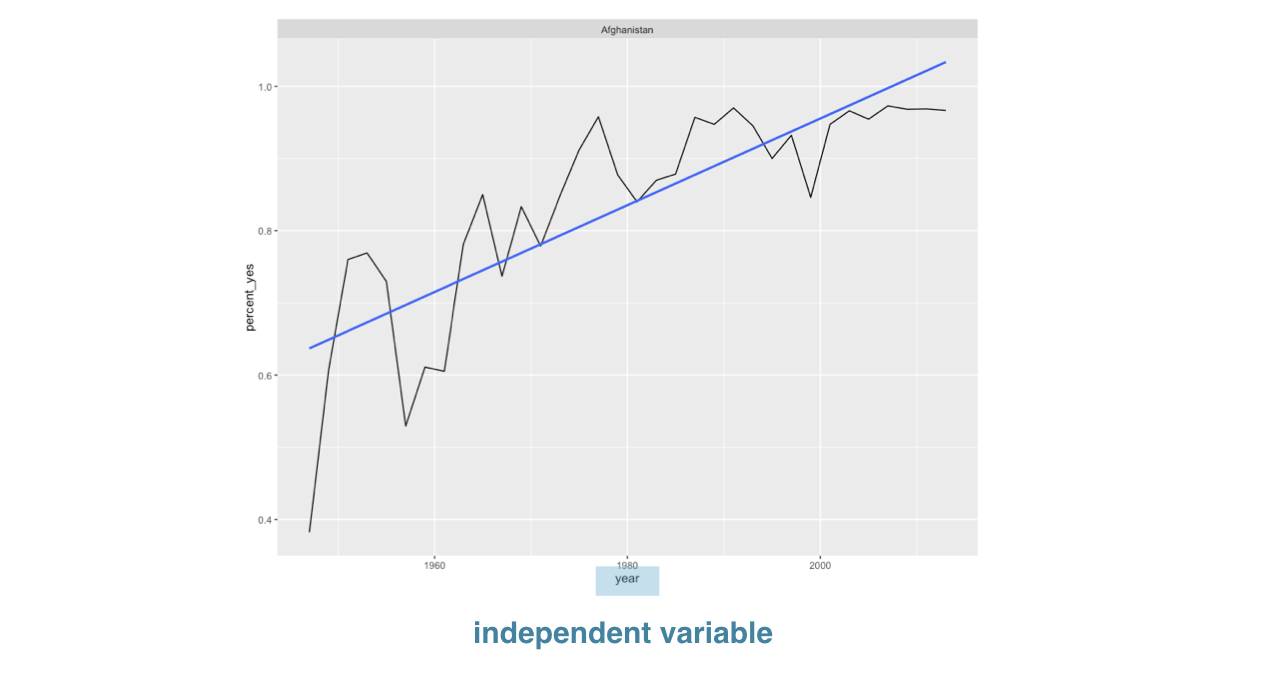
Linear regression
Case Study: Exploratory Data Analysis in R

Dave Robinson
Chief Data Scientist, DataCamp
Quantifying trends
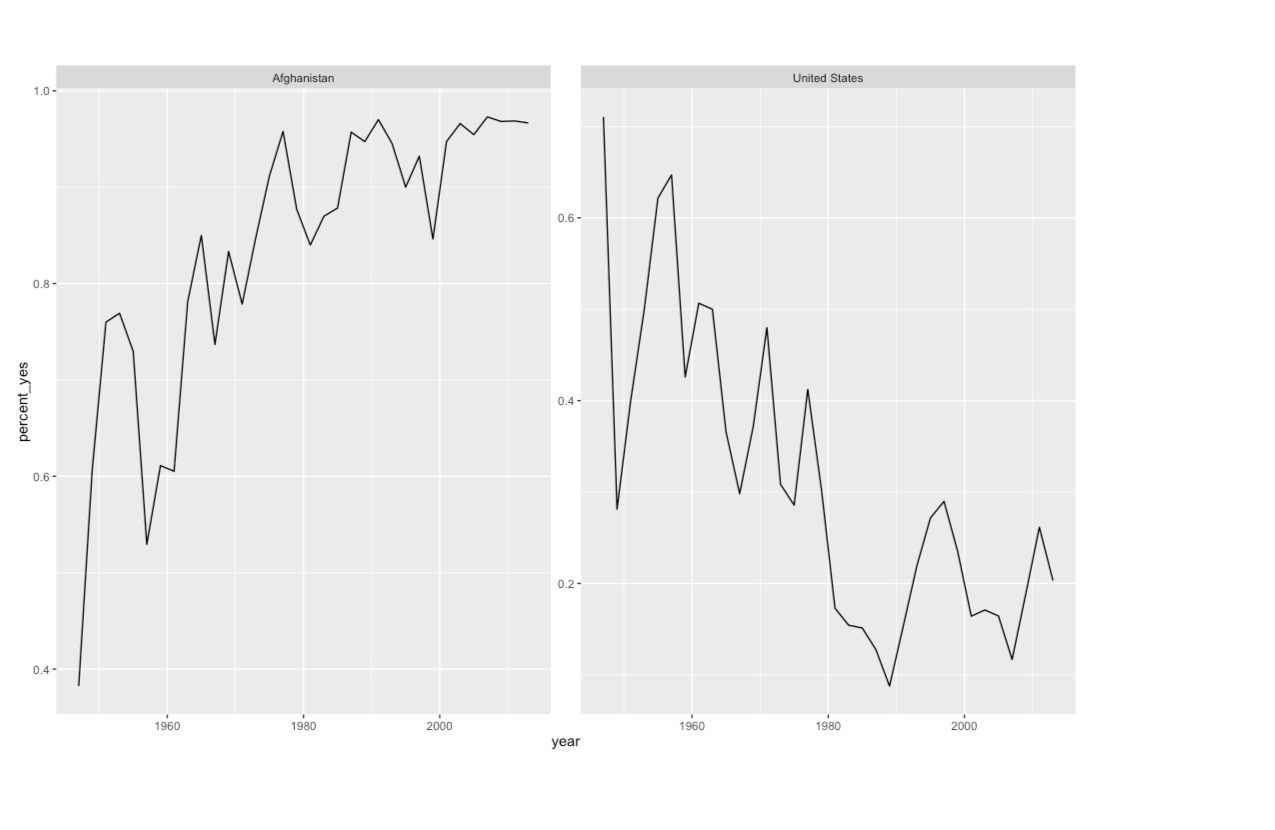
Linear regression
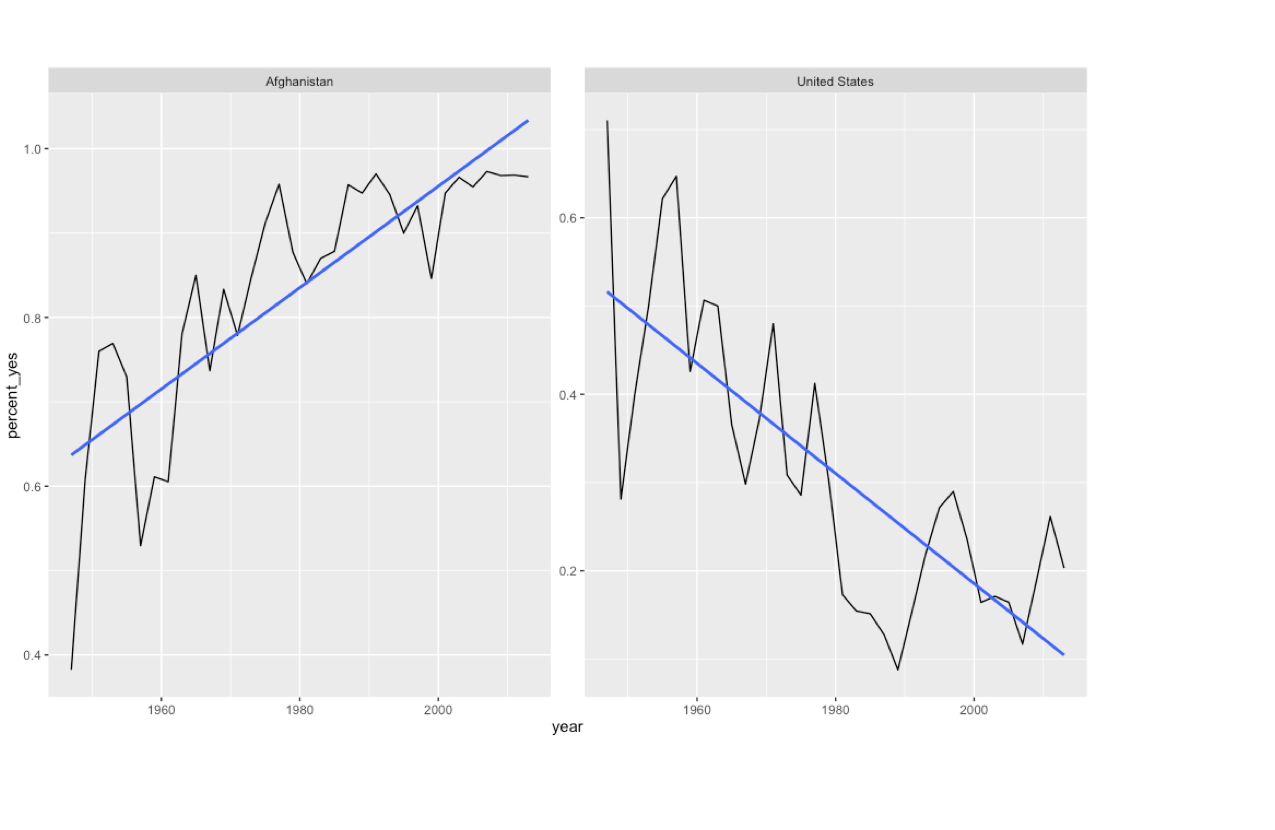
Linear regression
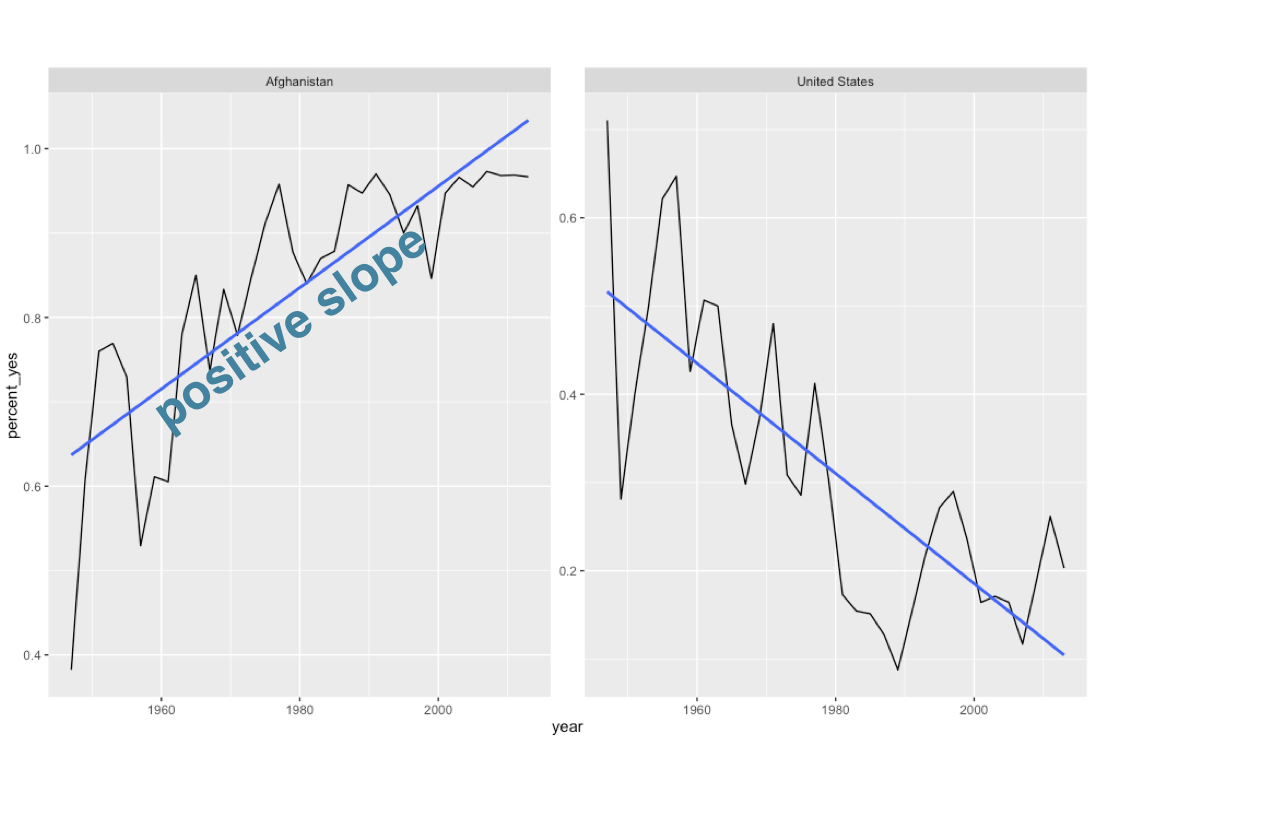
Linear regression
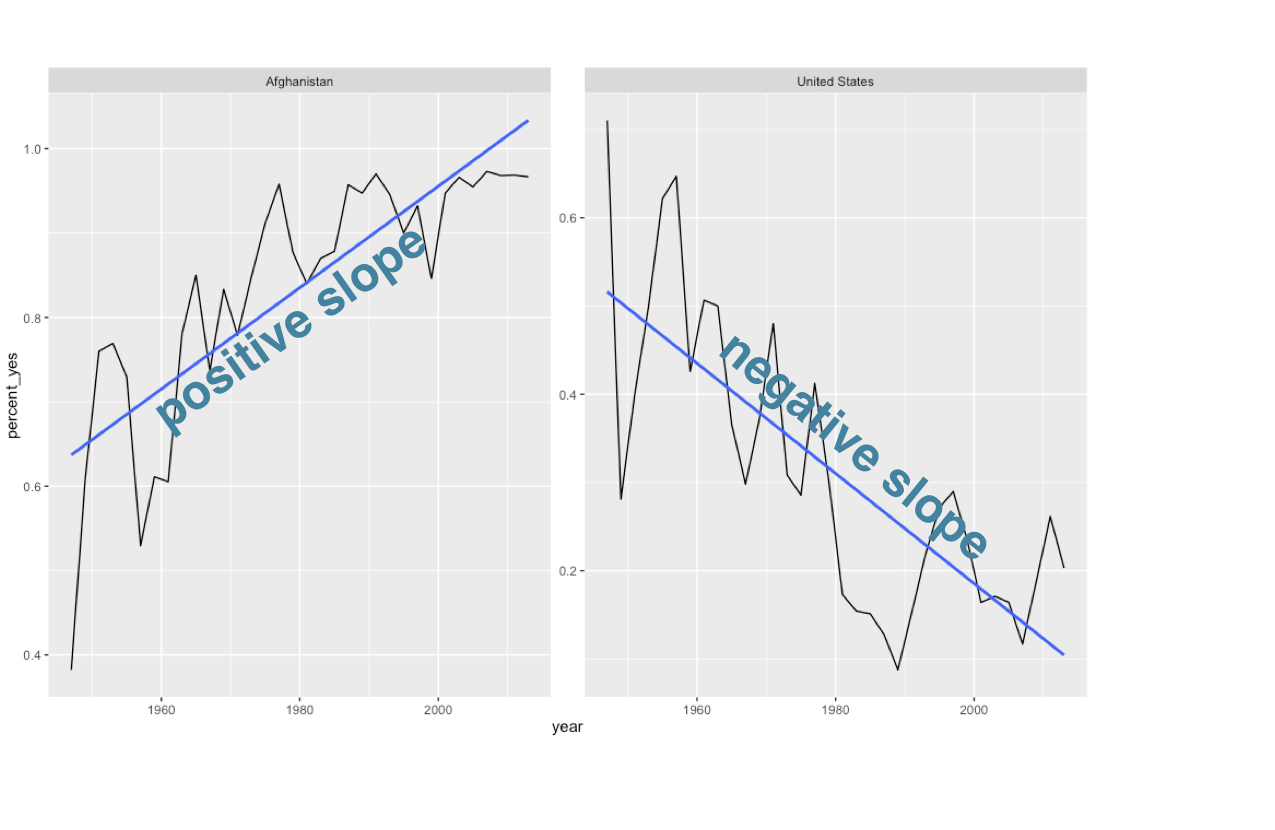
Fitting model to Afghanistan
model <- lm(percent_yes ~ year, data = afghanistan)
Fitting model to Afghanistan
Fitting model to Afghanistan
Visualization can surprise you, but it doesn’t scale well.