Introduction to Text Analysis in R
Maham Faisal Khan
Senior Data Science Content Developer
tidy_review %>%
  count(word, product) %>%
  arrange(desc(n))
# A tibble: 12,719 x 3
   word     product                                      n
   <chr>    <chr>                                    <int>
 1 clean    iRobot Roomba 880 for Pets and Allergies   815
 2 vacuum   iRobot Roomba 880 for Pets and Allergies   678
 3 hair     iRobot Roomba 880 for Pets and Allergies   595
# … with 12,716 more rows
tidy_review %>%
  count(word, product) %>%
  group_by(product) %>%
  slice_max(n, n = 10)
# A tibble: 20 x 3
# Groups:   product [2]
   word     product                                      n
   <chr>    <chr>                                    <int>
 1 650      iRobot Roomba 650 for Pets                 108
# … with 19 more rows
tidy_review %>%
  count(word, product) %>%
  group_by(product) %>%
  slice_max(n, n = 10) %>%
  ungroup()
# A tibble: 10 x 3
   word     product                                      n
   <chr>    <chr>                                    <int>
 1 650      iRobot Roomba 650 for Pets                 108
# … with 9 more rows
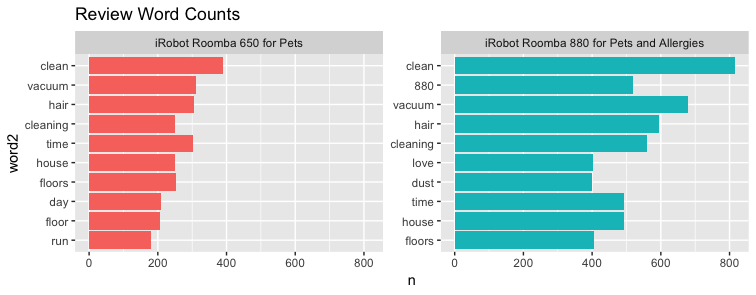
word_counts <- tidy_review %>%
  count(word, product) %>%
  group_by(product) %>%
  slice_max(n, n = 10) %>%
  ungroup() %>%
  mutate(word2 = fct_reorder(word, n))
ggplot(word_counts, aes(x = word2, y = n, fill = product)) +
  geom_col(show.legend = FALSE) +
  facet_wrap(~ product, scales = "free_y") +
  coord_flip() +
  ggtitle("Review Word Counts")