Introduction to Text Analysis in R
Maham Faisal Khan
Senior Data Science Content Developer
get_sentiments("bing")
# A tibble: 6,788 x 2
   word        sentiment
   <chr>       <chr>
 1 2-faced     negative
 2 2-faces     negative
 3 a+          positive
 4 abnormal    negative
 5 abolish     negative
# … with 6,783 more rows
get_sentiments("bing") %>%
  count(sentiment)
# A tibble: 2 x 2
  sentiment     n
  <chr>     <int>
1 negative   4782
2 positive   2006
get_sentiments("afinn")
# A tibble: 2,476 x 2
   word       value
   <chr>      <int>
 1 abandon       -2
 2 abandoned     -2
 3 abandons      -2
 4 abducted      -2
 5 abduction     -2
# … with 2,471 more rows
get_sentiments("afinn") %>%
  summarize(
    min = min(value),
    max = max(value)
  )
# A tibble: 1 x 2
    min   max
  <dbl> <dbl>
1    -5     5
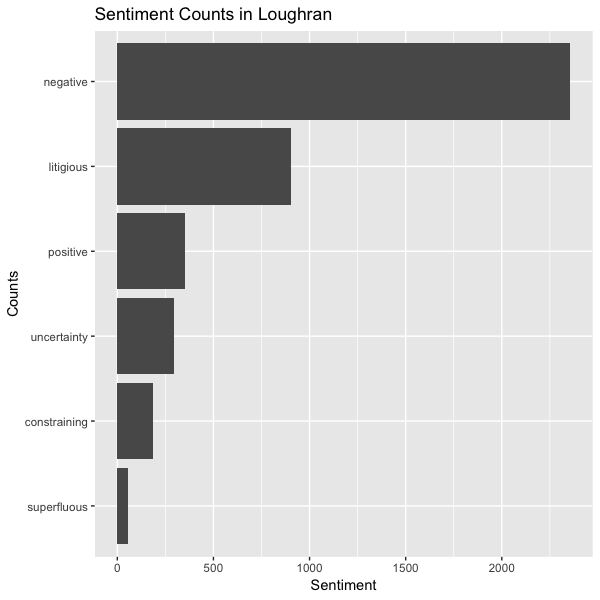
sentiment_counts <- get_sentiments("loughran") %>%
  count(sentiment) %>%
  mutate(sentiment2 = fct_reorder(sentiment, n))

ggplot(sentiment_counts, aes(x = sentiment2, y = n)) +
  geom_col() +
  coord_flip() +
  labs(
    title = "Sentiment Counts in Loughran",
    x = "Counts",
    y = "Sentiment"
  )
sentiment_counts <- get_sentiments("loughran") %>% count(sentiment) %>% mutate(sentiment2 = fct_reorder(sentiment, n))
ggplot(sentiment_counts, aes(x = sentiment2, y = n)) + geom_col() + coord_flip() + labs( title = "Sentiment Counts in Loughran", x = "Counts", y = "Sentiment" )