Improving sentiment analysis
Introduction to Text Analysis in R

Maham Faisal Khan
Senior Data Science Content Developer
Count sentiment by rating
tidy_review %>%
  inner_join(get_sentiments("bing")) %>%
  count(stars, sentiment)
# A tibble: 10 x 3
   stars sentiment     n
   <dbl> <chr>     <int>
 1     1 negative    381
 2     1 positive    241
 3     2 negative    384
# … with 7 more rows
Using pivot_wider()
tidy_review %>%
  inner_join(get_sentiments("bing")) %>%
  count(stars, sentiment) %>%
  pivot_wider(names_from = sentiment, values_from = n)
# A tibble: 5 x 3
  stars negative positive
  <dbl>    <int>    <int>
1     1      381      241
2     2      384      247
# … with 3 more rows
Computing overall sentiment
tidy_review %>%
  inner_join(get_sentiments("bing")) %>%
  count(stars, sentiment) %>%
  pivot_wider(names_from = sentiment, values_from = n)     %>%
  mutate(overall_sentiment = positive - negative)
# A tibble: 5 x 4
  stars negative positive overall_sentiment
  <dbl>    <int>    <int>             <int>
1     1      381      241              -140 ...
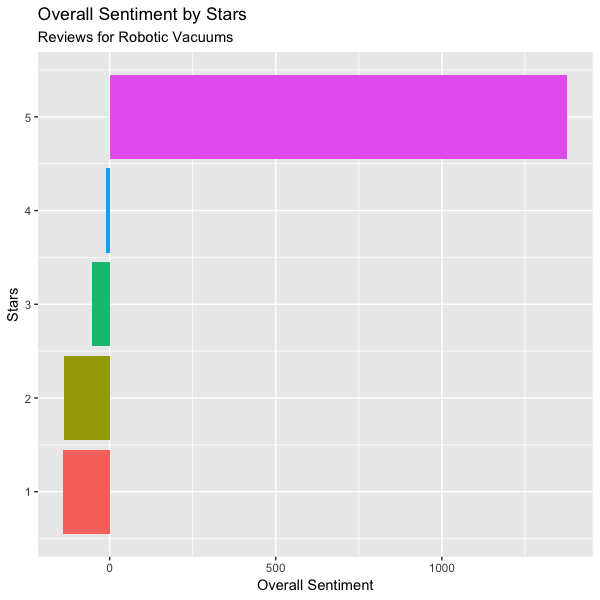
5     5     3705     5083              1378
Visualize sentiment by rating
sentiment_stars <- tidy_review %>%
  inner_join(get_sentiments("bing")) %>%
  count(stars, sentiment) %>%
  pivot_wider(names_from = sentiment, values_from = n)     %>%
  mutate(
    overall_sentiment = positive - negative,
    stars = fct_reorder(stars, overall_sentiment)
  )
Visualize sentiment by rating
ggplot(
  sentiment_stars,
  aes(x = stars, y = overall_sentiment, fill = as.factor(stars))
) +
  geom_col(show.legend = FALSE) +
  coord_flip() +
  labs(
    title = "Overall Sentiment by Stars",
    subtitle = "Reviews for Robotic Vacuums",
    x = "Stars",
    y = "Overall Sentiment"
  )

Let's practice!
Introduction to Text Analysis in R

