Hypothesis Testing with the Z-test

Introduction to Statistics in Google Sheets

Ted Kwartler

Data Dude

T-Tests

  • Google Sheets Formula:

    T.TEST(range1, range2, tails, type)
    
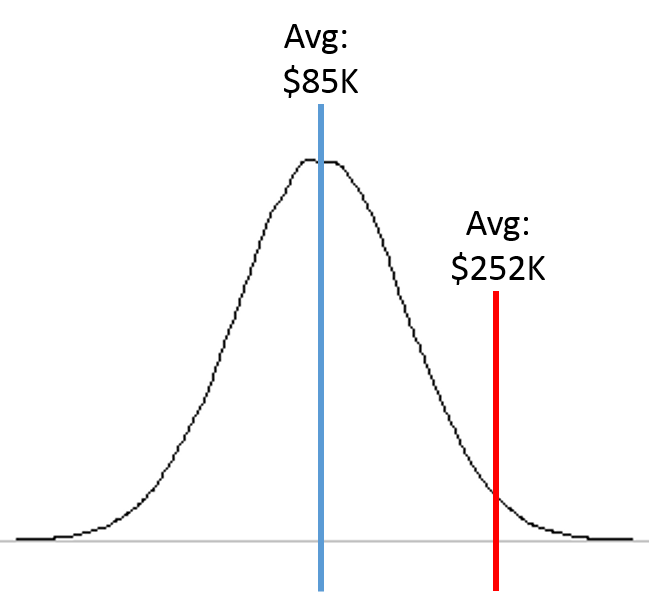
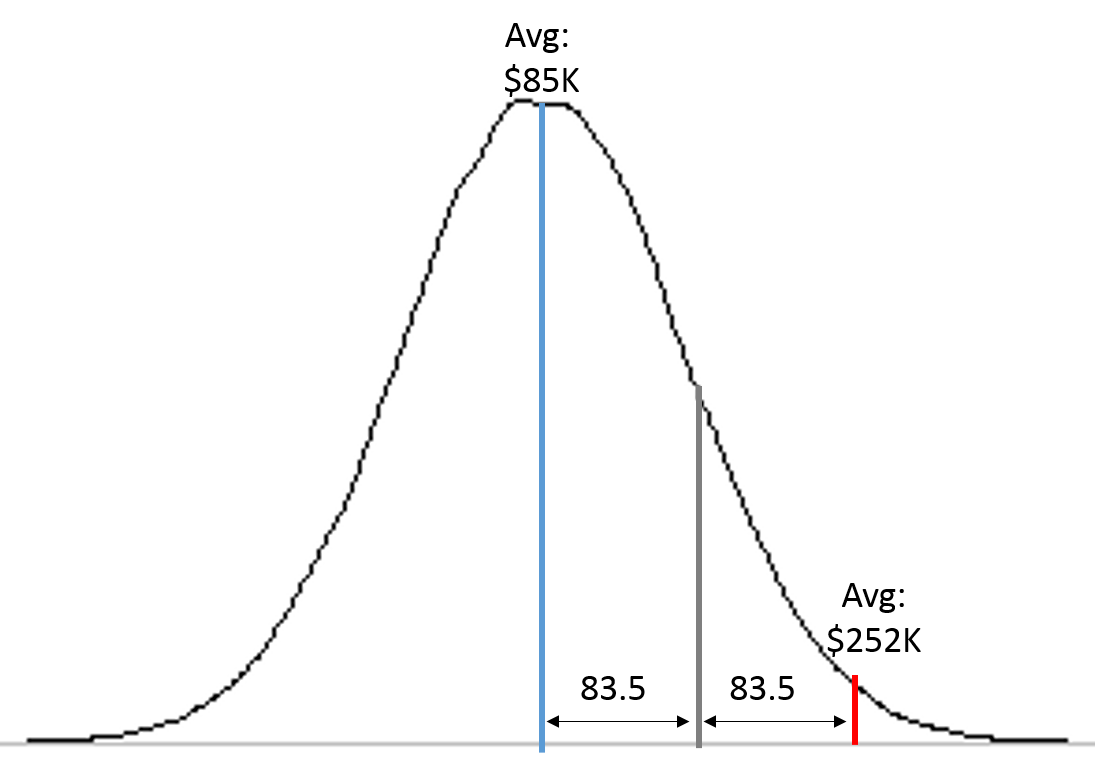
  • Infers whether there is a difference between two means

Introduction to Statistics in Google Sheets

Comparing T-Tests and Z-Tests

Similarities

  • Determine whether two population means are statistically different
  • Select a p-value cutoff prior to the test (Usually 0.05)
  • If the resulting p-value is less than 0.05, then REJECT H0
    • Else, FAIL TO REJECT H0.
Introduction to Statistics in Google Sheets

Contrasting T-Tests and Z-Tests

Z-Test

Formula:

=Z.TEST(range1, testStatistic, StDev)
  • Needs 1 range
  • Needs a test statistic (i.e, population mean)
  • Used with bigger datasets (n > 30)

T-Test

Formula:

T.TEST(range1, range2, tails, type)
  • Needs 2 ranges
  • Works when variance is unknown
  • Used with smaller datasets (n < 30)
1 https://keydifferences.com/difference-between-t-test-and-z-test.html
Introduction to Statistics in Google Sheets

Introduction to Statistics in Google Sheets


Introduction to Statistics in Google Sheets

Z-Tests calculate the probability

Introduction to Statistics in Google Sheets

Z-Tests in Google Sheets

Z.TEST(data, value, [standard_deviation])

  • FAIL TO REJECT H0 if the -value is greater than 0.05
  • REJECT H0 if the p-value is less than 0.05
Introduction to Statistics in Google Sheets

Let's practice!

Introduction to Statistics in Google Sheets

Preparing Video For Download...