How far from average?

Introduction to Statistics in Google Sheets

Ted Kwartler

Data Dude

All aboard!

Introduction to Statistics in Google Sheets

First stop, Variance Station

  • Measures how dispersed a dataset is
  • Smaller variance indicates a dataset is less spread
  • Large differences between data points increase the variance
Introduction to Statistics in Google Sheets

First stop, Variance Station

A
347
347
347
347
Introduction to Statistics in Google Sheets

First stop, Variance Station

A
347
347
347
347
  • Column A Variance: 0
Introduction to Statistics in Google Sheets

First stop, Variance Station

A B
347 10
347 14
347 10
347 10
  • Column A Variance: 0
Introduction to Statistics in Google Sheets

First stop, Variance Station

A B
347 10
347 14
347 10
347 10
  • Column A Variance: 0
  • Column B Variance: 3
Introduction to Statistics in Google Sheets

First stop, Variance Station

A B C
347 10 10
347 14 14
347 10 100
347 10 10
  • Column A Variance: 0
  • Column B Variance: 3
Introduction to Statistics in Google Sheets

First stop, Variance Station

A B C
347 10 10
347 14 14
347 10 100
347 10 10
  • Column A Variance: 0
  • Column B Variance: 3
  • Column C Variance: 1476.75
Introduction to Statistics in Google Sheets

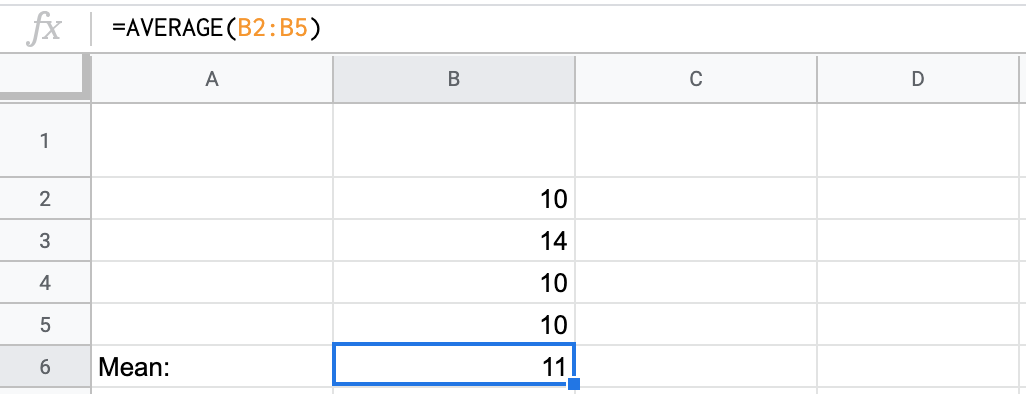
Calculating Variance: Step 1

Variance_1.png

Introduction to Statistics in Google Sheets

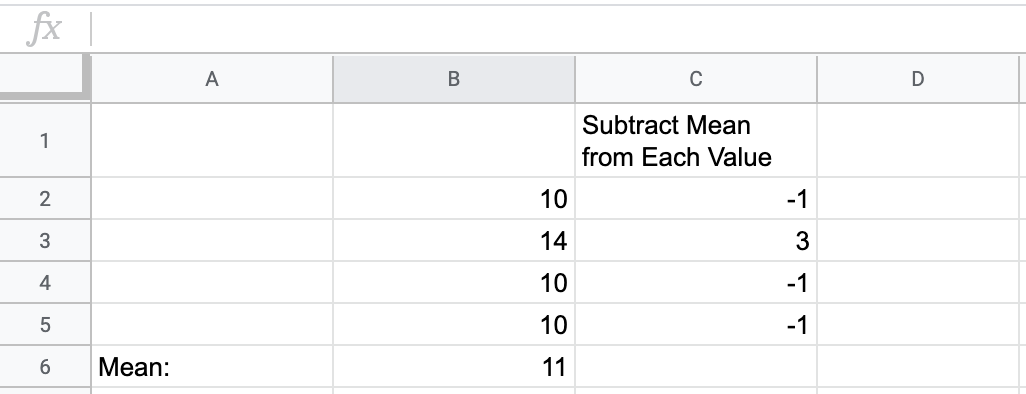
Calculating Variance: Step 2

Variance_2.png

Introduction to Statistics in Google Sheets

Calculating Variance: Step 3

Variance_3.png

Introduction to Statistics in Google Sheets

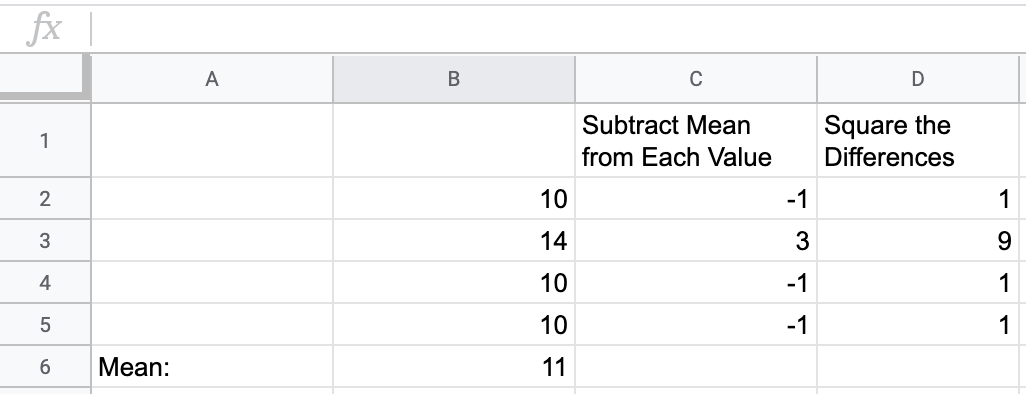
Calculating Variance: Step 4

Variance_4.png

Introduction to Statistics in Google Sheets

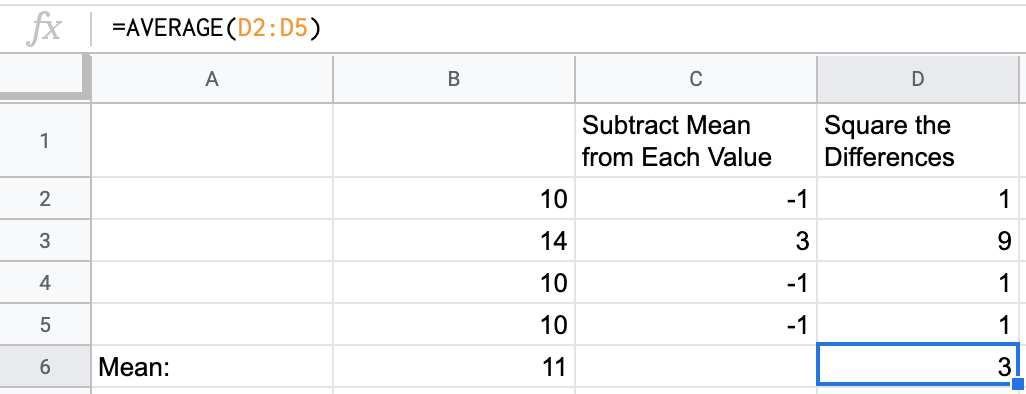
Calculating variance in spreadsheets

Variance_Example.gif

Introduction to Statistics in Google Sheets

Pulling into, Standard Deviation!
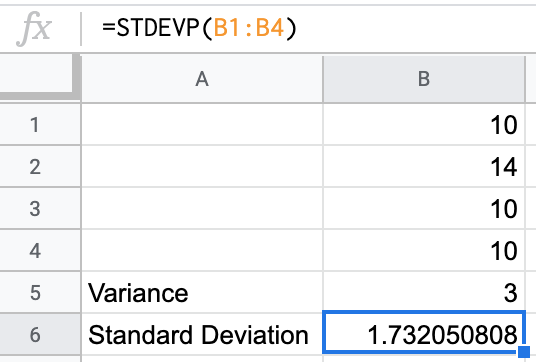
https://www.pexels.com/photo/train-by-trees-against-blue-sky-325200/

Introduction to Statistics in Google Sheets

Standard Deviation

Manual Standard Deviation:

manual_std_dev.png

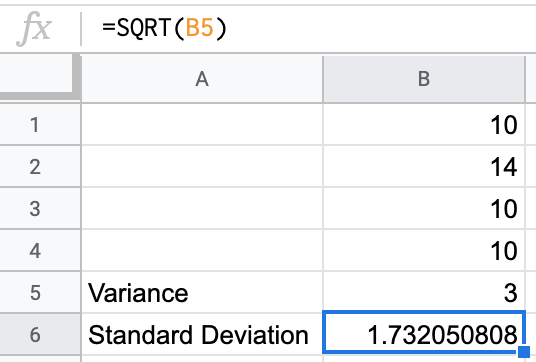
Google Sheets Standard Deviation:

sheets_std_dev.png

Introduction to Statistics in Google Sheets

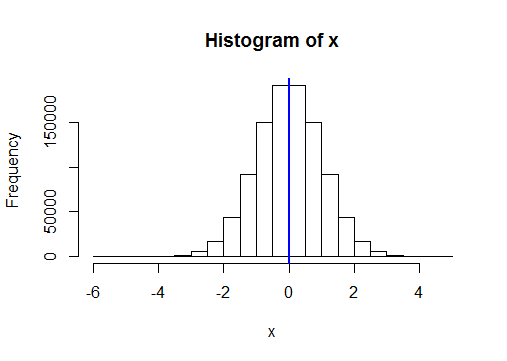
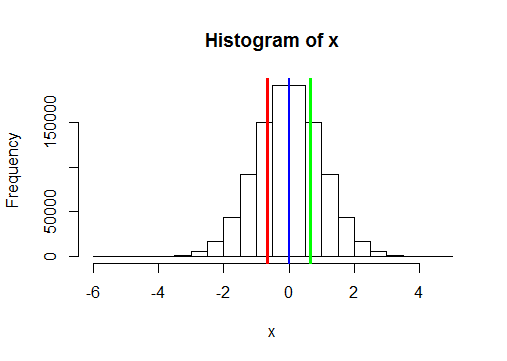
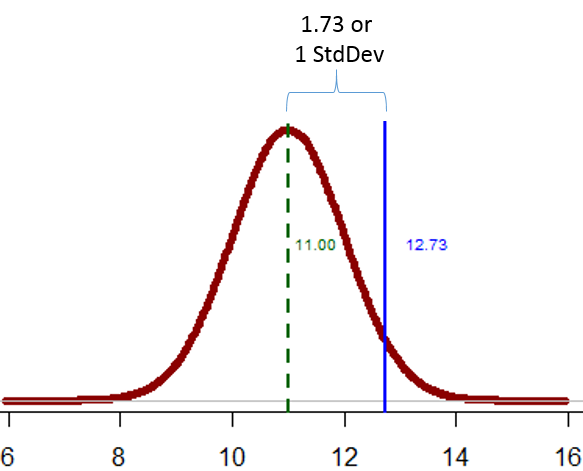
Standard Deviation as a unit of measure

Sample average & standard deviation

=AVERAGE(10,14,10,10) = 11
=STDEVP(10,14,10,10) = 1.73

New Data Point: 12.73

12.73 - 1.73 = 11

One Standard Deviation

Introduction to Statistics in Google Sheets

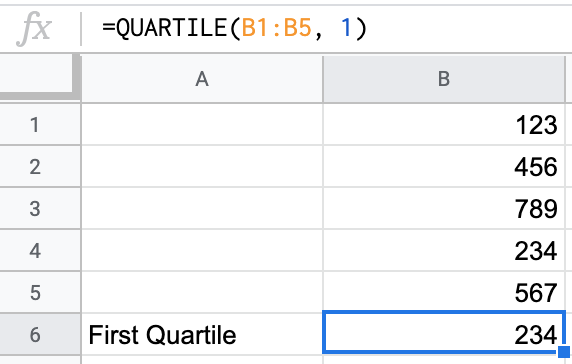
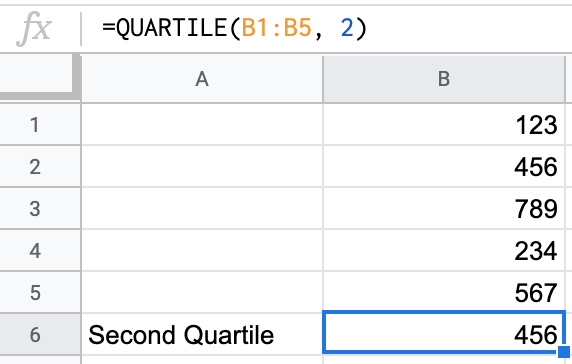
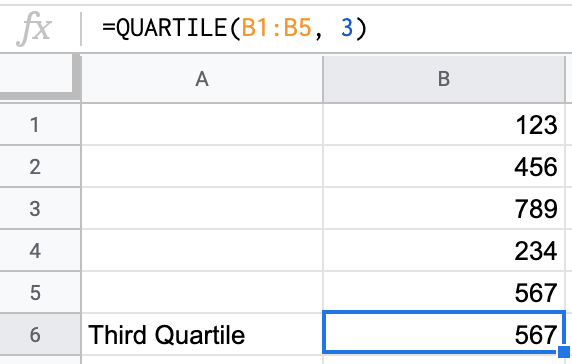
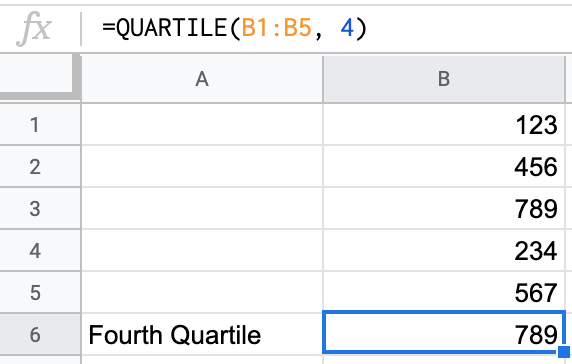
Last distribution stop on the stats train: quartiles

Distribution

  • Percentile: % of values below a specific point
  • 50th percentile: Splits the data evenly
  • Here, 0 is the 50th percentile
Introduction to Statistics in Google Sheets

distro

Introduction to Statistics in Google Sheets

first_quartile.png

second_quartile.png

third_quartile.png

fourth_quartile.png

Introduction to Statistics in Google Sheets

Let's practice!

Introduction to Statistics in Google Sheets

Preparing Video For Download...