Comparing groups
Reporting in SQL

Tyler Pernes
Learning & Development Consultant
Types of metrics
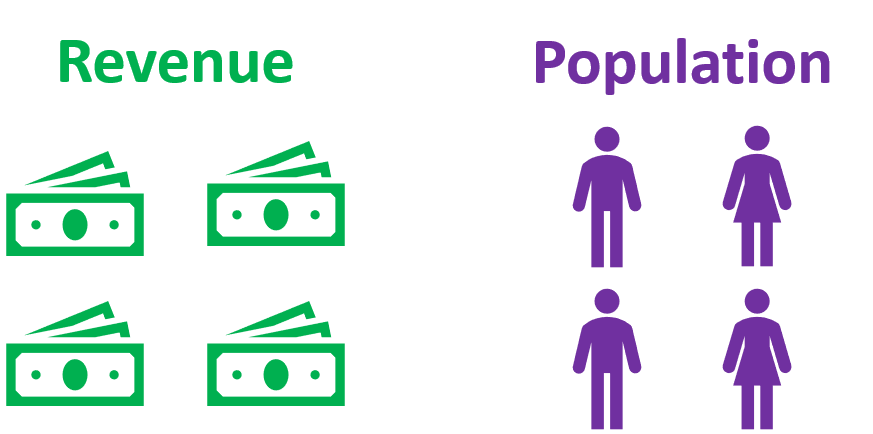
- Volume metrics
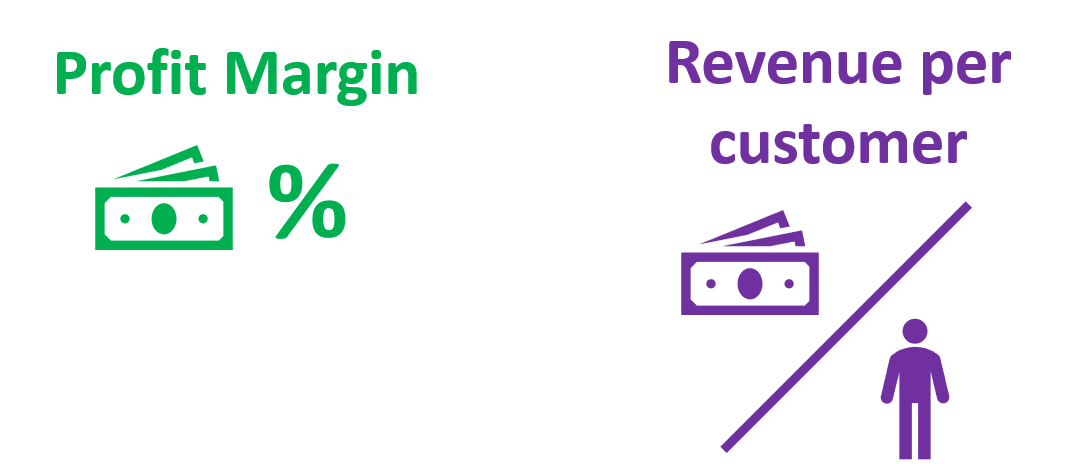
- Efficiency metrics
Volume metrics
- Scale with size
Volume metrics
- Scale with size

Volume metrics
- Scale with size

Percent of total calculation
basketball_points table
+----------+------------+---------+
| team_id  | player_id  | points  |
|----------|------------|---------|
| 1        | 482        | 92      |
| 1        | 165        | 47      |
| 2        | 222        | 64      |
+----------+------------+---------+
SELECT team_id, SUM(points) AS points
FROM basketball_points
GROUP BY team_id;
Percent of total calculation
basketball_points table
+----------+------------+---------+
| team_id  | player_id  | points  |
|----------|------------|---------|
| 1        | 482        | 92      |
| 1        | 165        | 47      |
| 2        | 222        | 64      |
+----------+------------+---------+
+----------+---------+
| team_id  | points  |
|----------|---------|
| 1        | 782     |
| 2        | 625     |
| 3        | 487     |
| 4        | 398     |
+----------+---------+
Percent of total calculation
Step 1: Calculate total
SELECT
    team_id,
    SUM(points) AS points
    SUM(points) OVER () AS total_points
FROM basketball_points
GROUP BY team_id;
Step 2: Calculate percent of total
SELECT
    team_id,
    SUM(points) AS points
    SUM(points) / SUM(points) OVER () AS perc_of_total
FROM basketball_points
GROUP BY team_id;
Percent of total calculation
Results:
+----------+---------+---------------+
| team_id  | points  | perc_of_total |
|----------|---------|---------------|
| 1        | 782     | .34           |
| 2        | 625     | .27           |
| 3        | 487     | .21           |
| 4        | 398     | .17           |
+----------+---------+---------------+
Percent of total calculation
Percent of points scored per player for each team:
SELECT
    player_id,
    team_id,
    SUM(points) AS points
    SUM(points) / (SUM(points) OVER (PARTITION BY team_id)) AS perc_of_team
FROM basketball_points
GROUP BY player_id, team_id;
Percent of total calculation
Results:
+-----------+---------+---------+--------------+
| player_id | team_id | points  | perc_of_team |
|-----------|---------|---------|--------------|
| 482       | 1       | 92      | .12          |
| 165       | 1       | 47      | .06          |
| 222       | 2       | 64      | .10          |
+-----------+---------+---------+--------------+
Efficiency metrics
- Does not scale with size
- Typically a ratio
Efficiency metrics
- Does not scale with size
- Typically a ratio

Efficiency metrics
- Does not scale with size
- Typically a ratio

Performance index
- Compares performance to a benchmark
- Benchmark typically an average or median
Performance index
basketball_summary table
+----------+--------+---------+
| team_id  | games  | points  |
|----------|--------|---------|
| 1        | 24     | 782     |
| 2        | 20     | 625     |
| 3        | 12     | 487     |
+----------+--------+---------+
- Points per game performance?
Performance index
Step 1: points per game for each team
SELECT
    team_id,
    points/games AS team_ppg
FROM basketball_summary;
Step 2: points per game for entire league
SELECT
    team_id,
    points/games AS team_ppg,
    SUM(points) OVER () / SUM(games) OVER () AS league_ppg
FROM basketball_summary;
Performance index
Step 3: performance index
SELECT
    team_id,
    points/games AS team_ppg,
    SUM(points) OVER () / SUM(games) OVER () AS league_ppg,
    (points/games)
    /
    (SUM(points) OVER () / SUM(games) OVER ()) AS perf_index
FROM basketball_summary;
Performance index
Step 3: performance index
+----------+----------+------------+-------------+
| team_id  | team_ppg | league_ppg | perf_index  |
|----------|----------|------------|-------------|
| 1        | 32.6     | 33.8       | 0.96        |
| 2        | 31.3     | 33.8       | 0.92        |
| 3        | 40.6     | 33.8       | 1.20        |
+----------+----------+------------+-------------+
1 The results clearly state that team three scores 20% more points than the league average.
Query time!
Reporting in SQL

