The sum of random variables tends to a normal distribution as the number of them grows to infinity.
Conditions:
The variables must have the same distribution.
The variables must be independent.
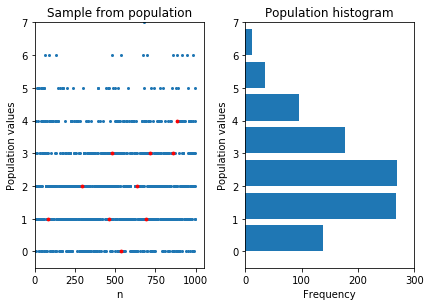
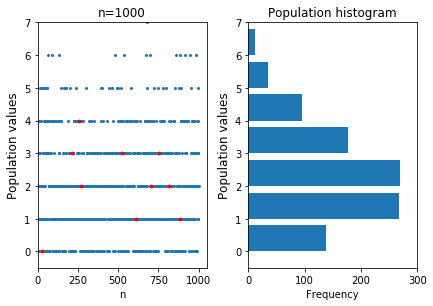
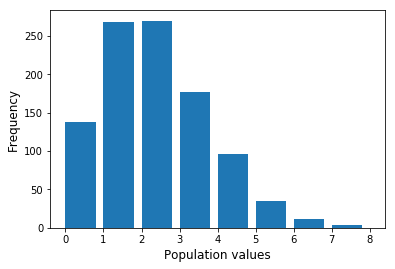
Poisson population plot
# Add the imports
from scipy.stats import poisson, describe
from matplotlib import pyplot as plt
import numpy as np
# Generate the population
population = poisson.rvs(mu=2, size=1000, random_state=20)
# Draw the histogram with labels
plt.hist(population, bins=range(9), width=0.8)
plt.show()
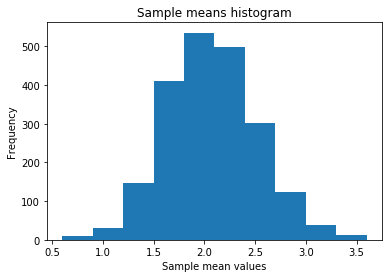
Sample means plot
# Generate 350 sample means, selecting
# from population values
np.random.seed(42)

# Define list of sample means
sample_means = []
for _ in range(350):
    # Select 10 from population
    sample = np.random.choice(population, 10)
    # Calculate sample mean of sample
    sample_means.append(describe(sample).mean)
Sample means plot (Cont.)
$$
$$
# Draw histogram with labels
plt.xlabel("Sample mean values")
plt.ylabel("Frequency")
plt.title("Sample means histogram")
plt.hist(sample_means)
plt.show()