Foundations of Probability in Python
Alexander A. Ramírez M.
CEO @ Synergy Vision
$$ $$
The sample mean approaches the expected value as the sample size increases.
$$ \text{Sample mean} = \bar{X_2} = \frac{x_1+x_2}{2} $$
$$ \text{Sample mean} = \bar{X_3} = \frac{x_1+x_2+x_3}{3} $$
$$ \text{Sample mean} = \bar{X_n} = \frac{x_1+x_2+\cdots +x_n}{n} $$
$$ \text{Sample mean} = \bar{X_n} = \frac{x_1+x_2+\cdots +x_n}{n} \to \mathbb{E(X)} $$
# Import binom and describe
from scipy.stats import binom
from scipy.stats import describe
# Sample of 250 fair coin flips
samples = binom.rvs(n=1, p=0.5, size=250, random_state=42)
# Print first 100 values from the sample
print(samples[0:100])
[0 1 1 1 0 0 0 1 1 1 0 1 1 0 0 0 0 1 0 0 1 0 0 0 0 1 0 1 1 0 1 0 0 1 1 1 0
0 1 0 0 0 0 1 0 1 0 1 1 0 1 1 1 1 1 1 0 0 0 0 0 0 1 0 0 1 0 1 0 1 1 0 0 1
1 1 1 0 0 0 1 1 0 0 0 0 1 1 1 0 0 1 1 1 1 0 1 0 0 0]
# Calculate the sample mean
print(describe(samples[0:10]).mean)
0.6
$$ $$
from scipy.stats import binom
from scipy.stats import describe
import matplotlib.pyplot as plt
# Define our variables
coin_flips, p, sample_size , averages = 1, 0.5, 1000, []
# Generate the sample
samples = binom.rvs(n=coin_flips, p=p, size=sample_size, random_state=42)
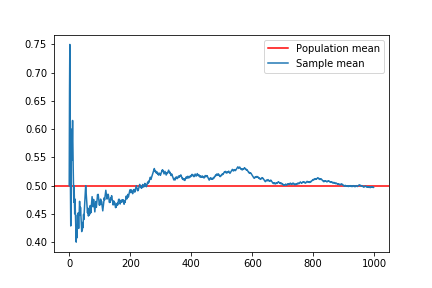
$$ $$
# Calculate the sample mean
for i in range(2,sample_size+1):
averages.append(describe(samples[0:i]).mean)
# Print the first values of averages
print(averages[0:10])
[0.5, 0.6666666666666666, 0.75, 0.6, 0.5, 0.42857142857142855, 0.5,
0.5555555555555556,0.6, 0.5454545454545454]
$$ $$
# Add population mean line and sample mean plot
plt.axhline(binom.mean(n=coin_flips, p=p), color='red')
plt.plot(averages, '-')
# Add legend
plt.legend(("Population mean","Sample mean"), loc='upper right')
plt.show()
Foundations of Probability in Python