Tweaking your plots
Improving Your Data Visualizations in Python

Nick Strayer
Instructor
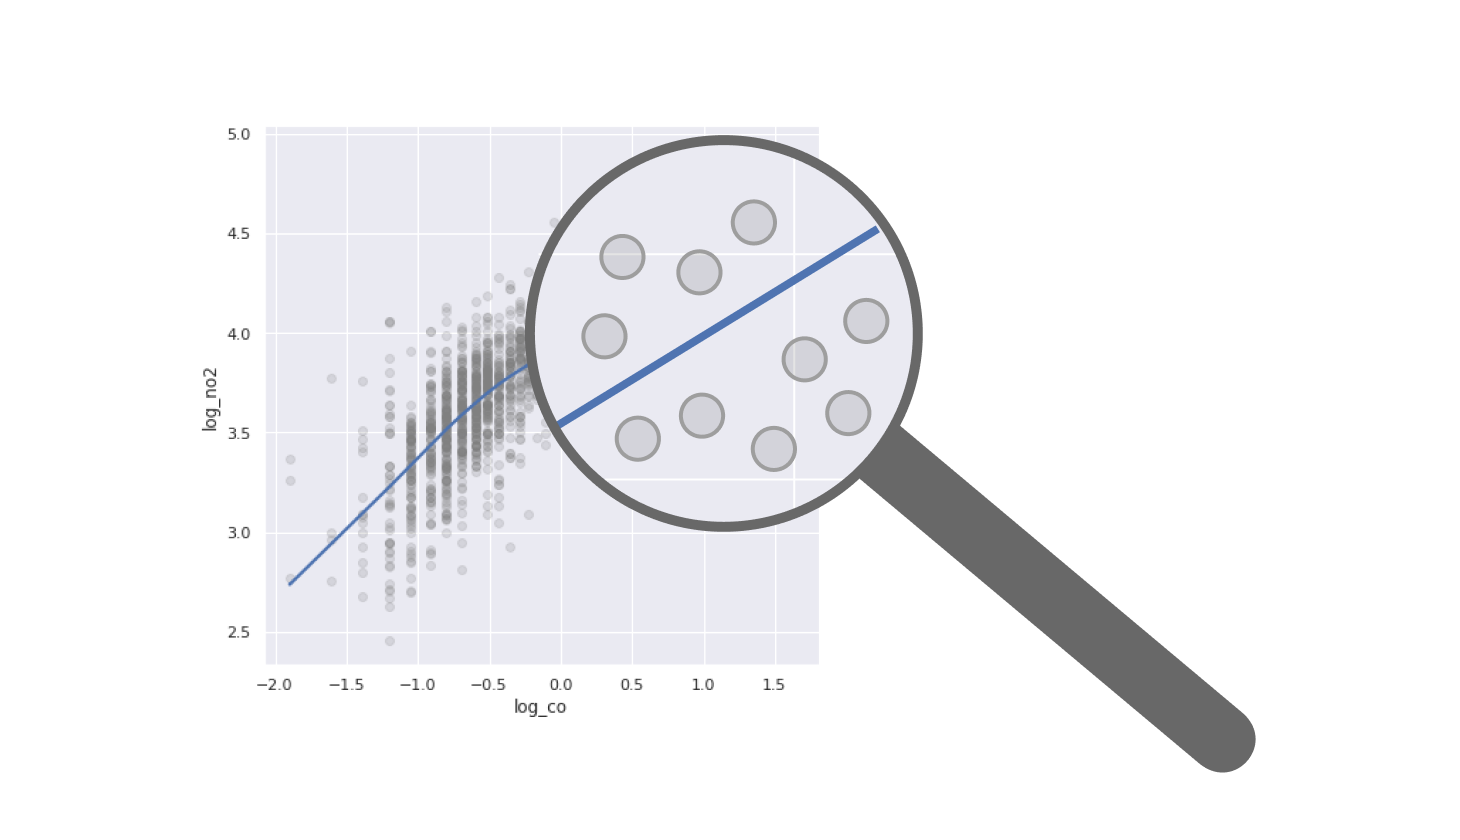
Looking at the small things
- Put yourself into the viewer's shoes
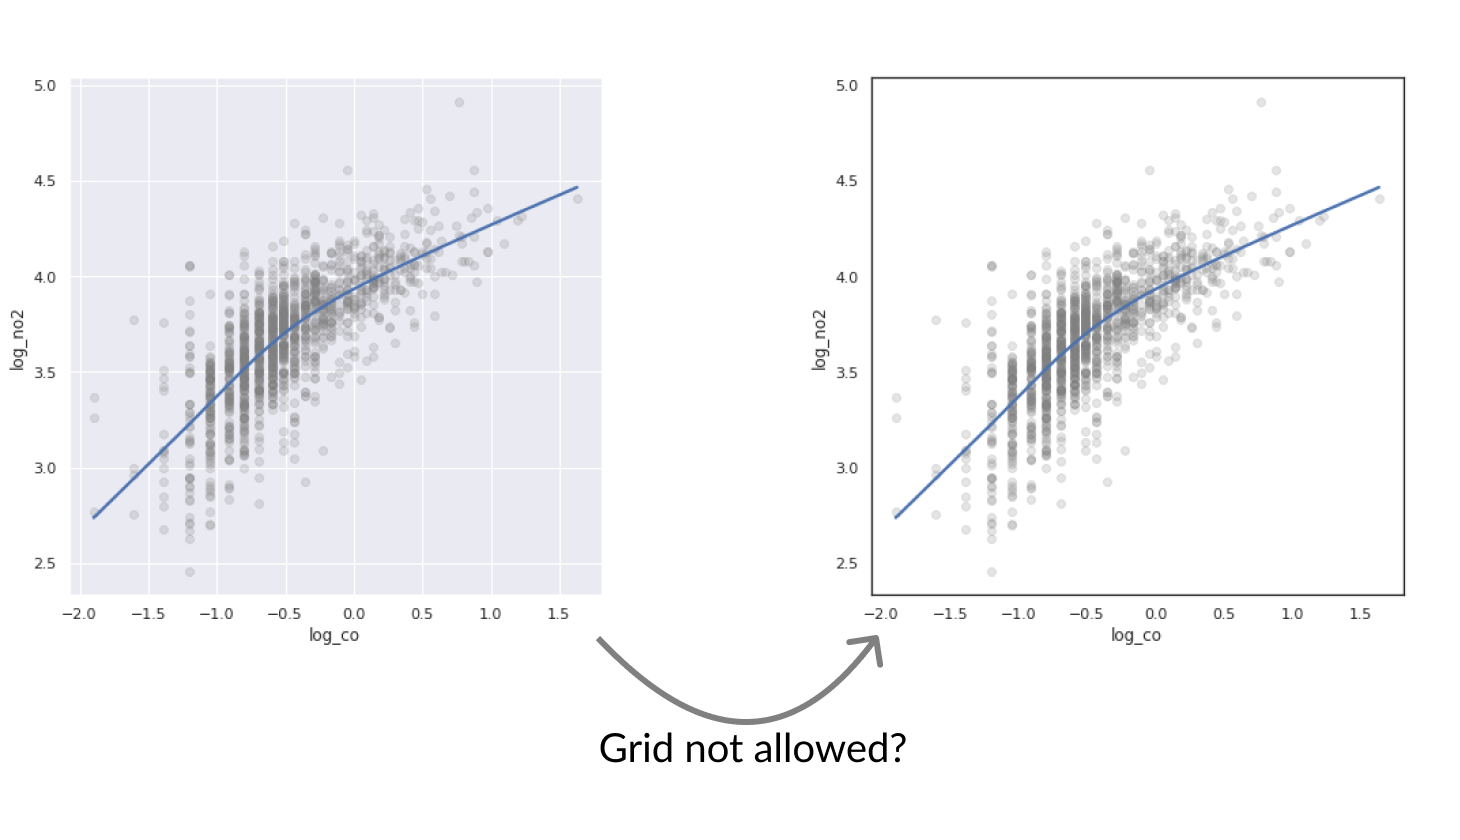
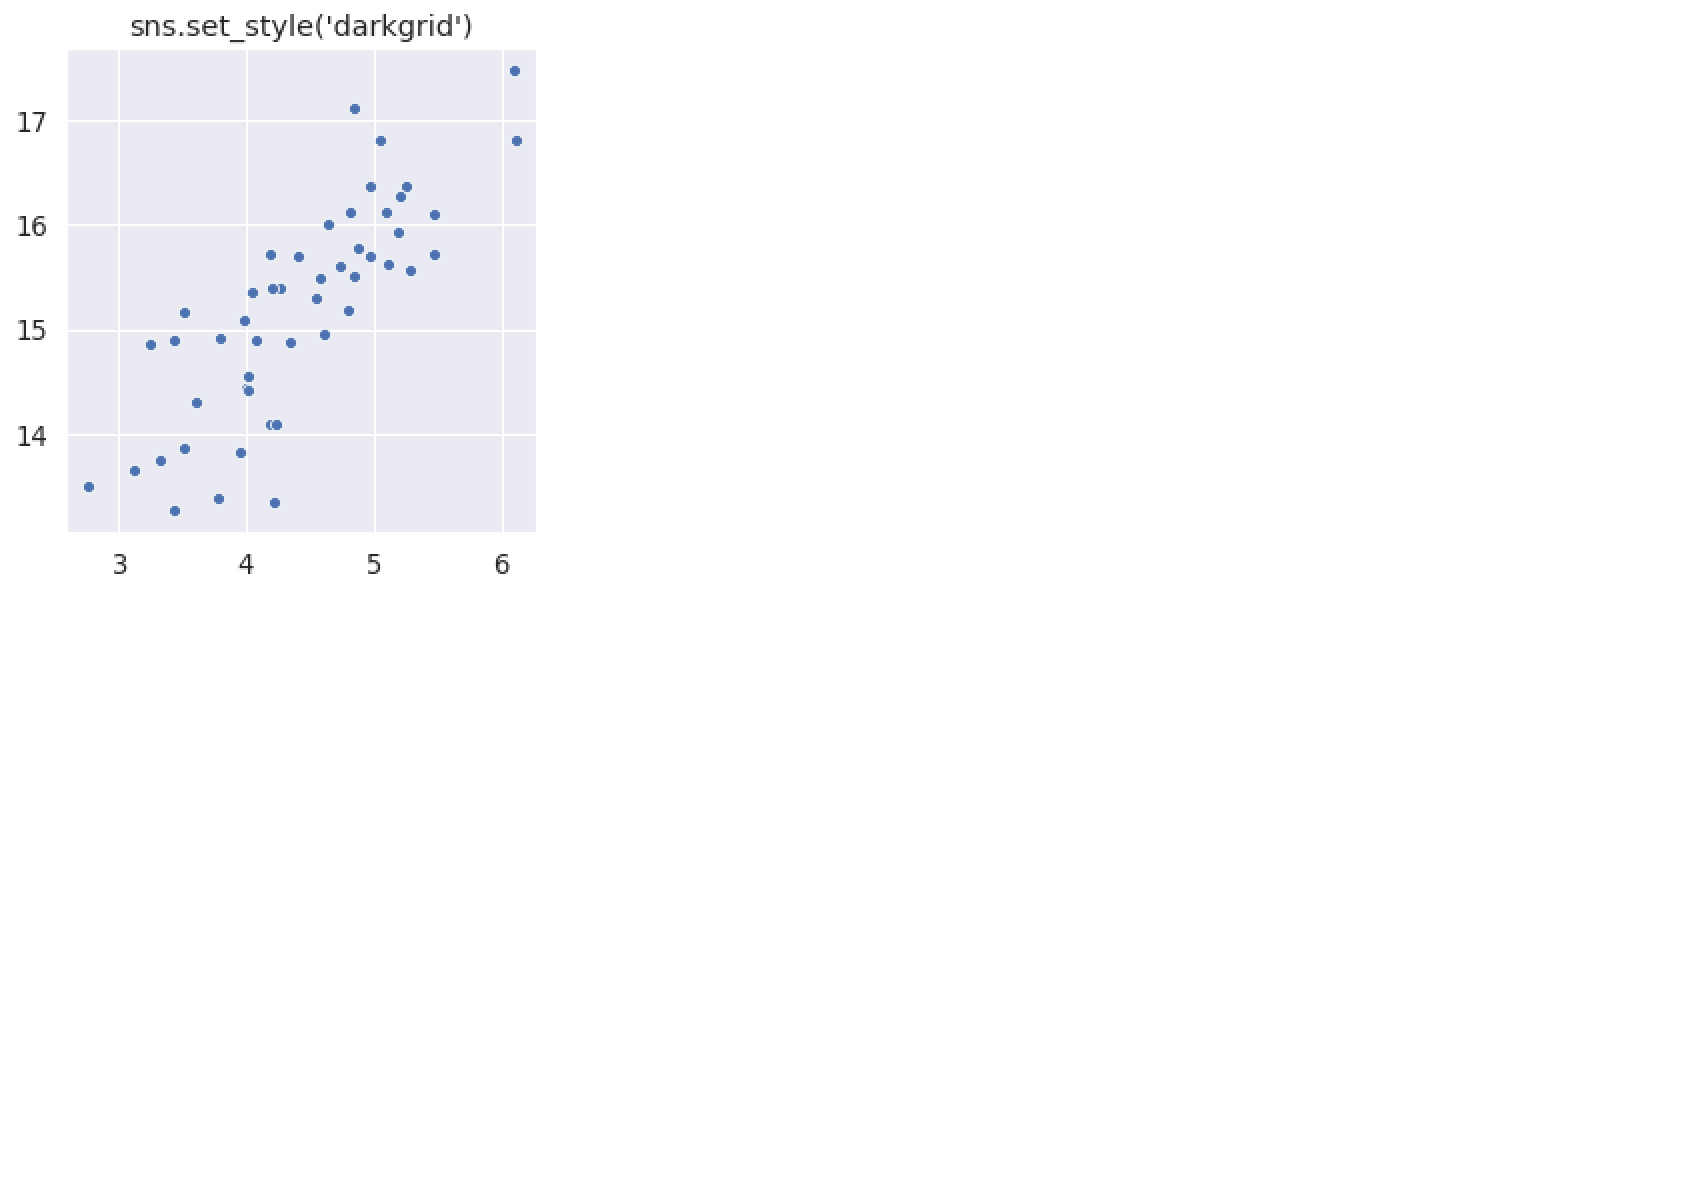
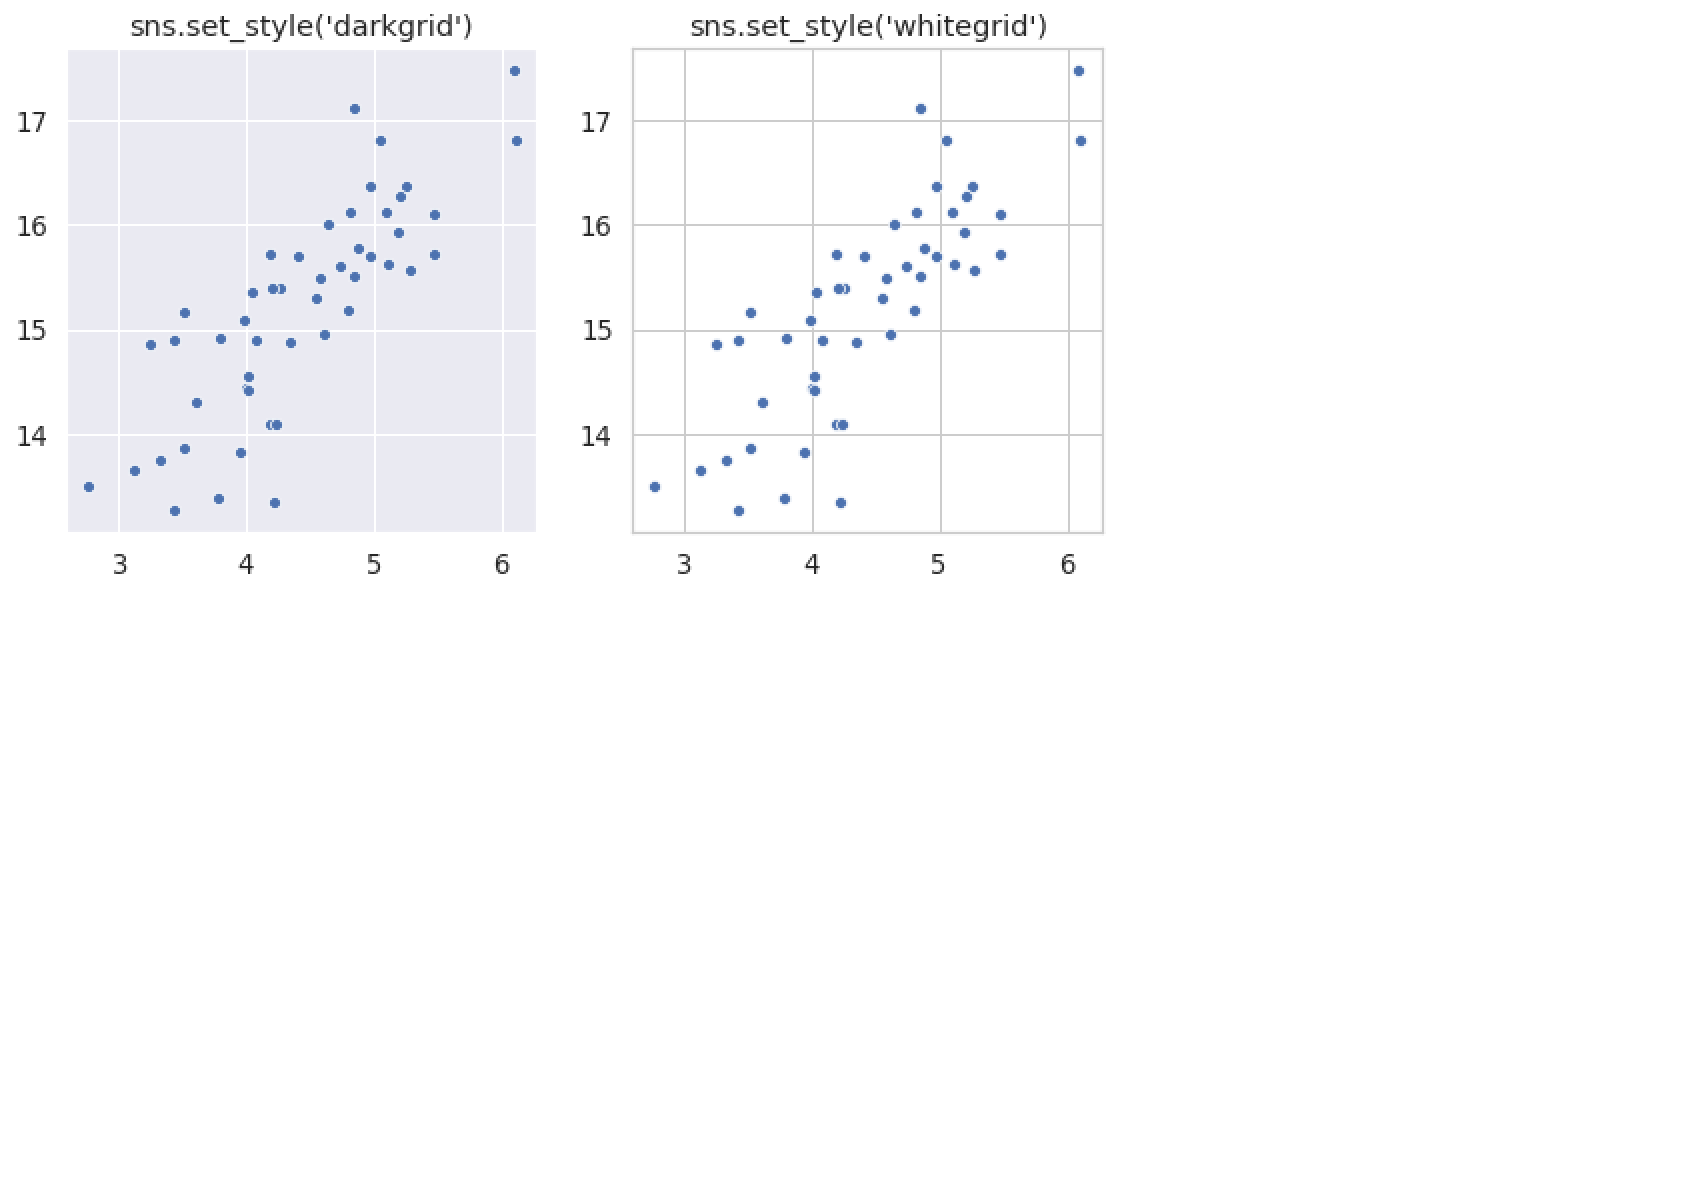
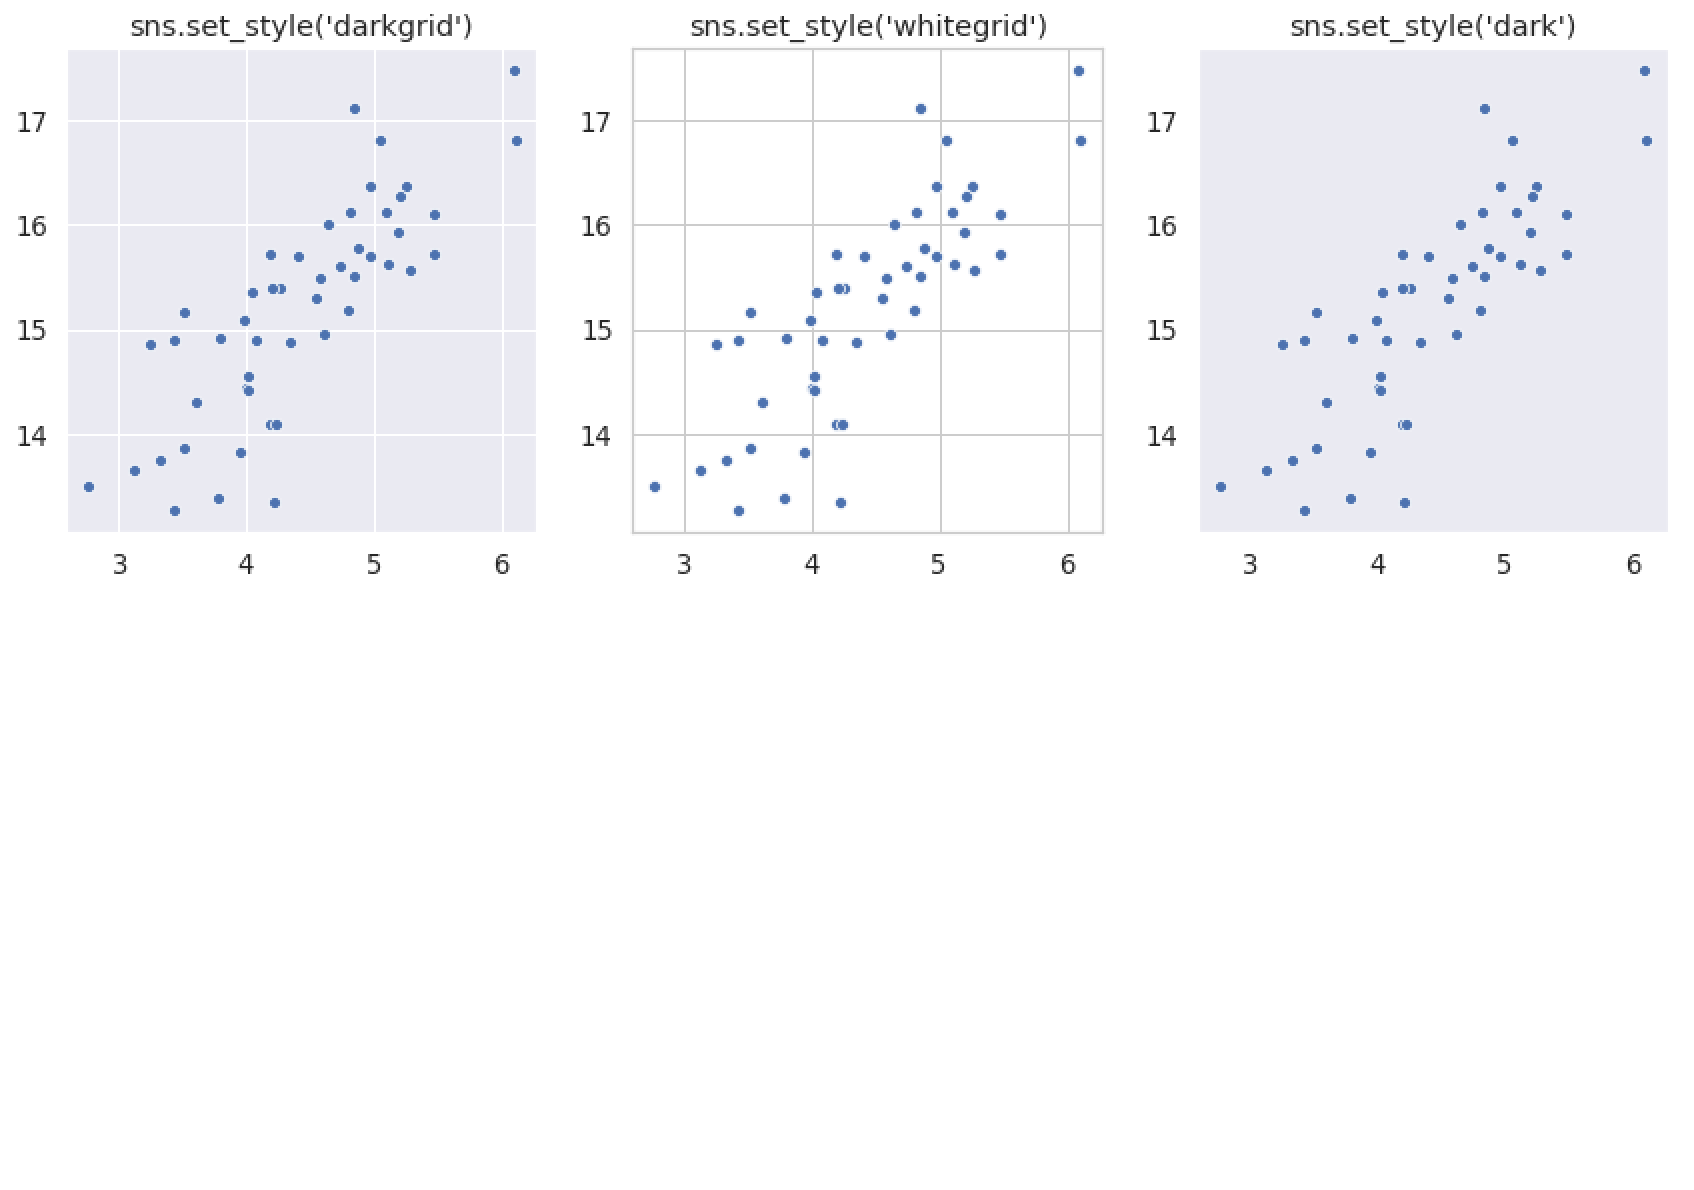
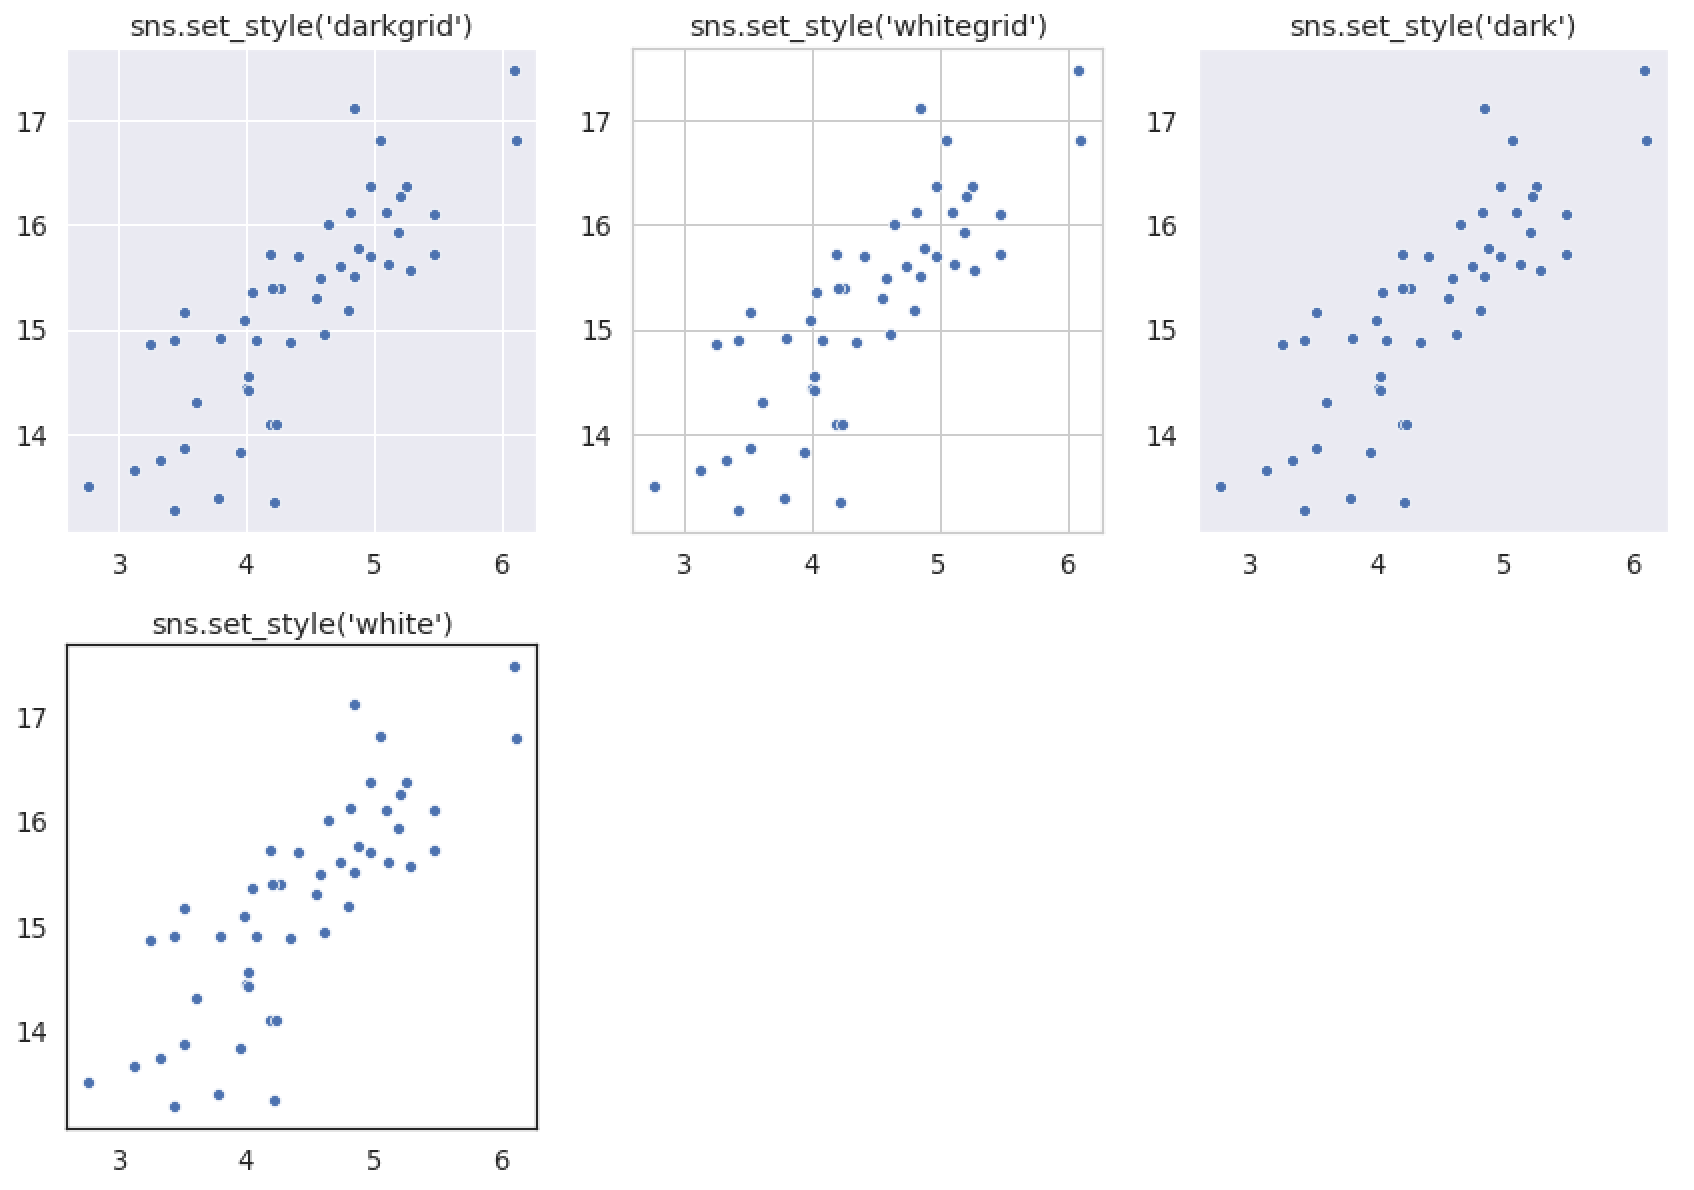
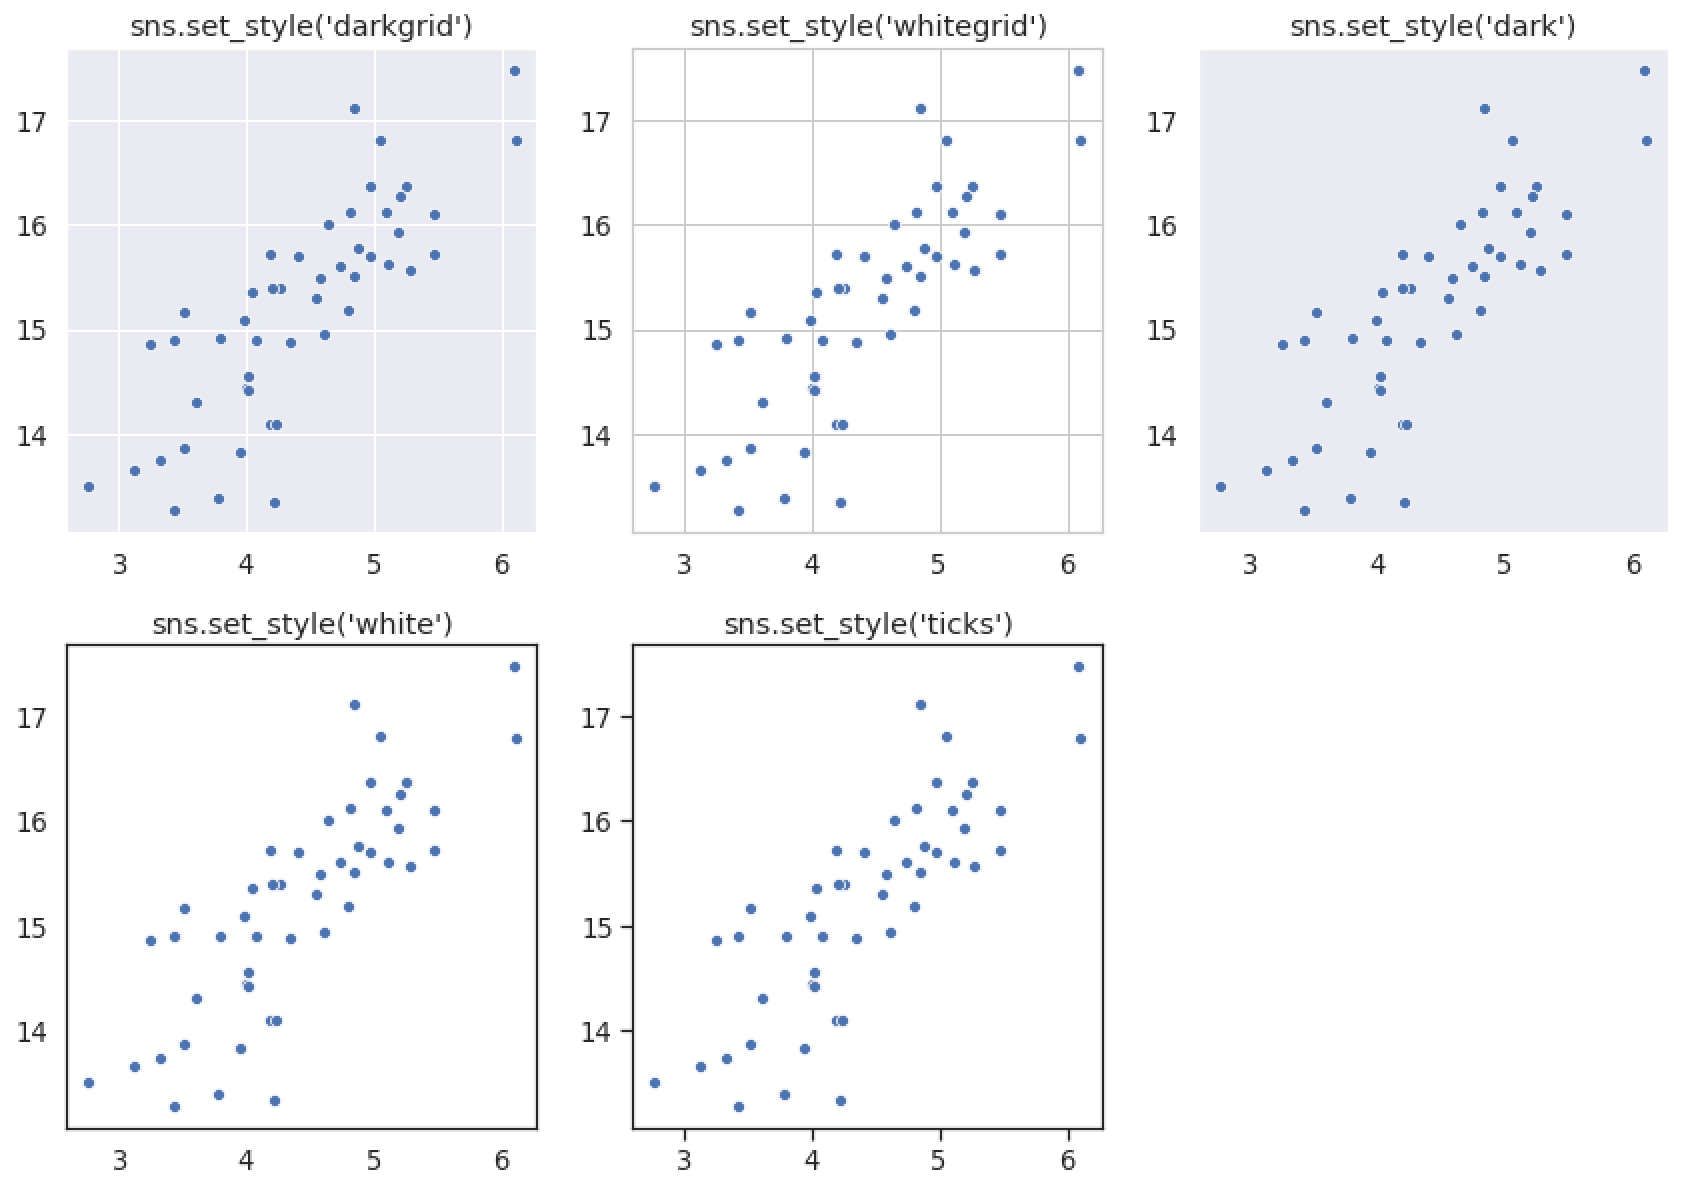
Is the aesthetic appropriate?
- Is the aesthetic appropriate for the context?
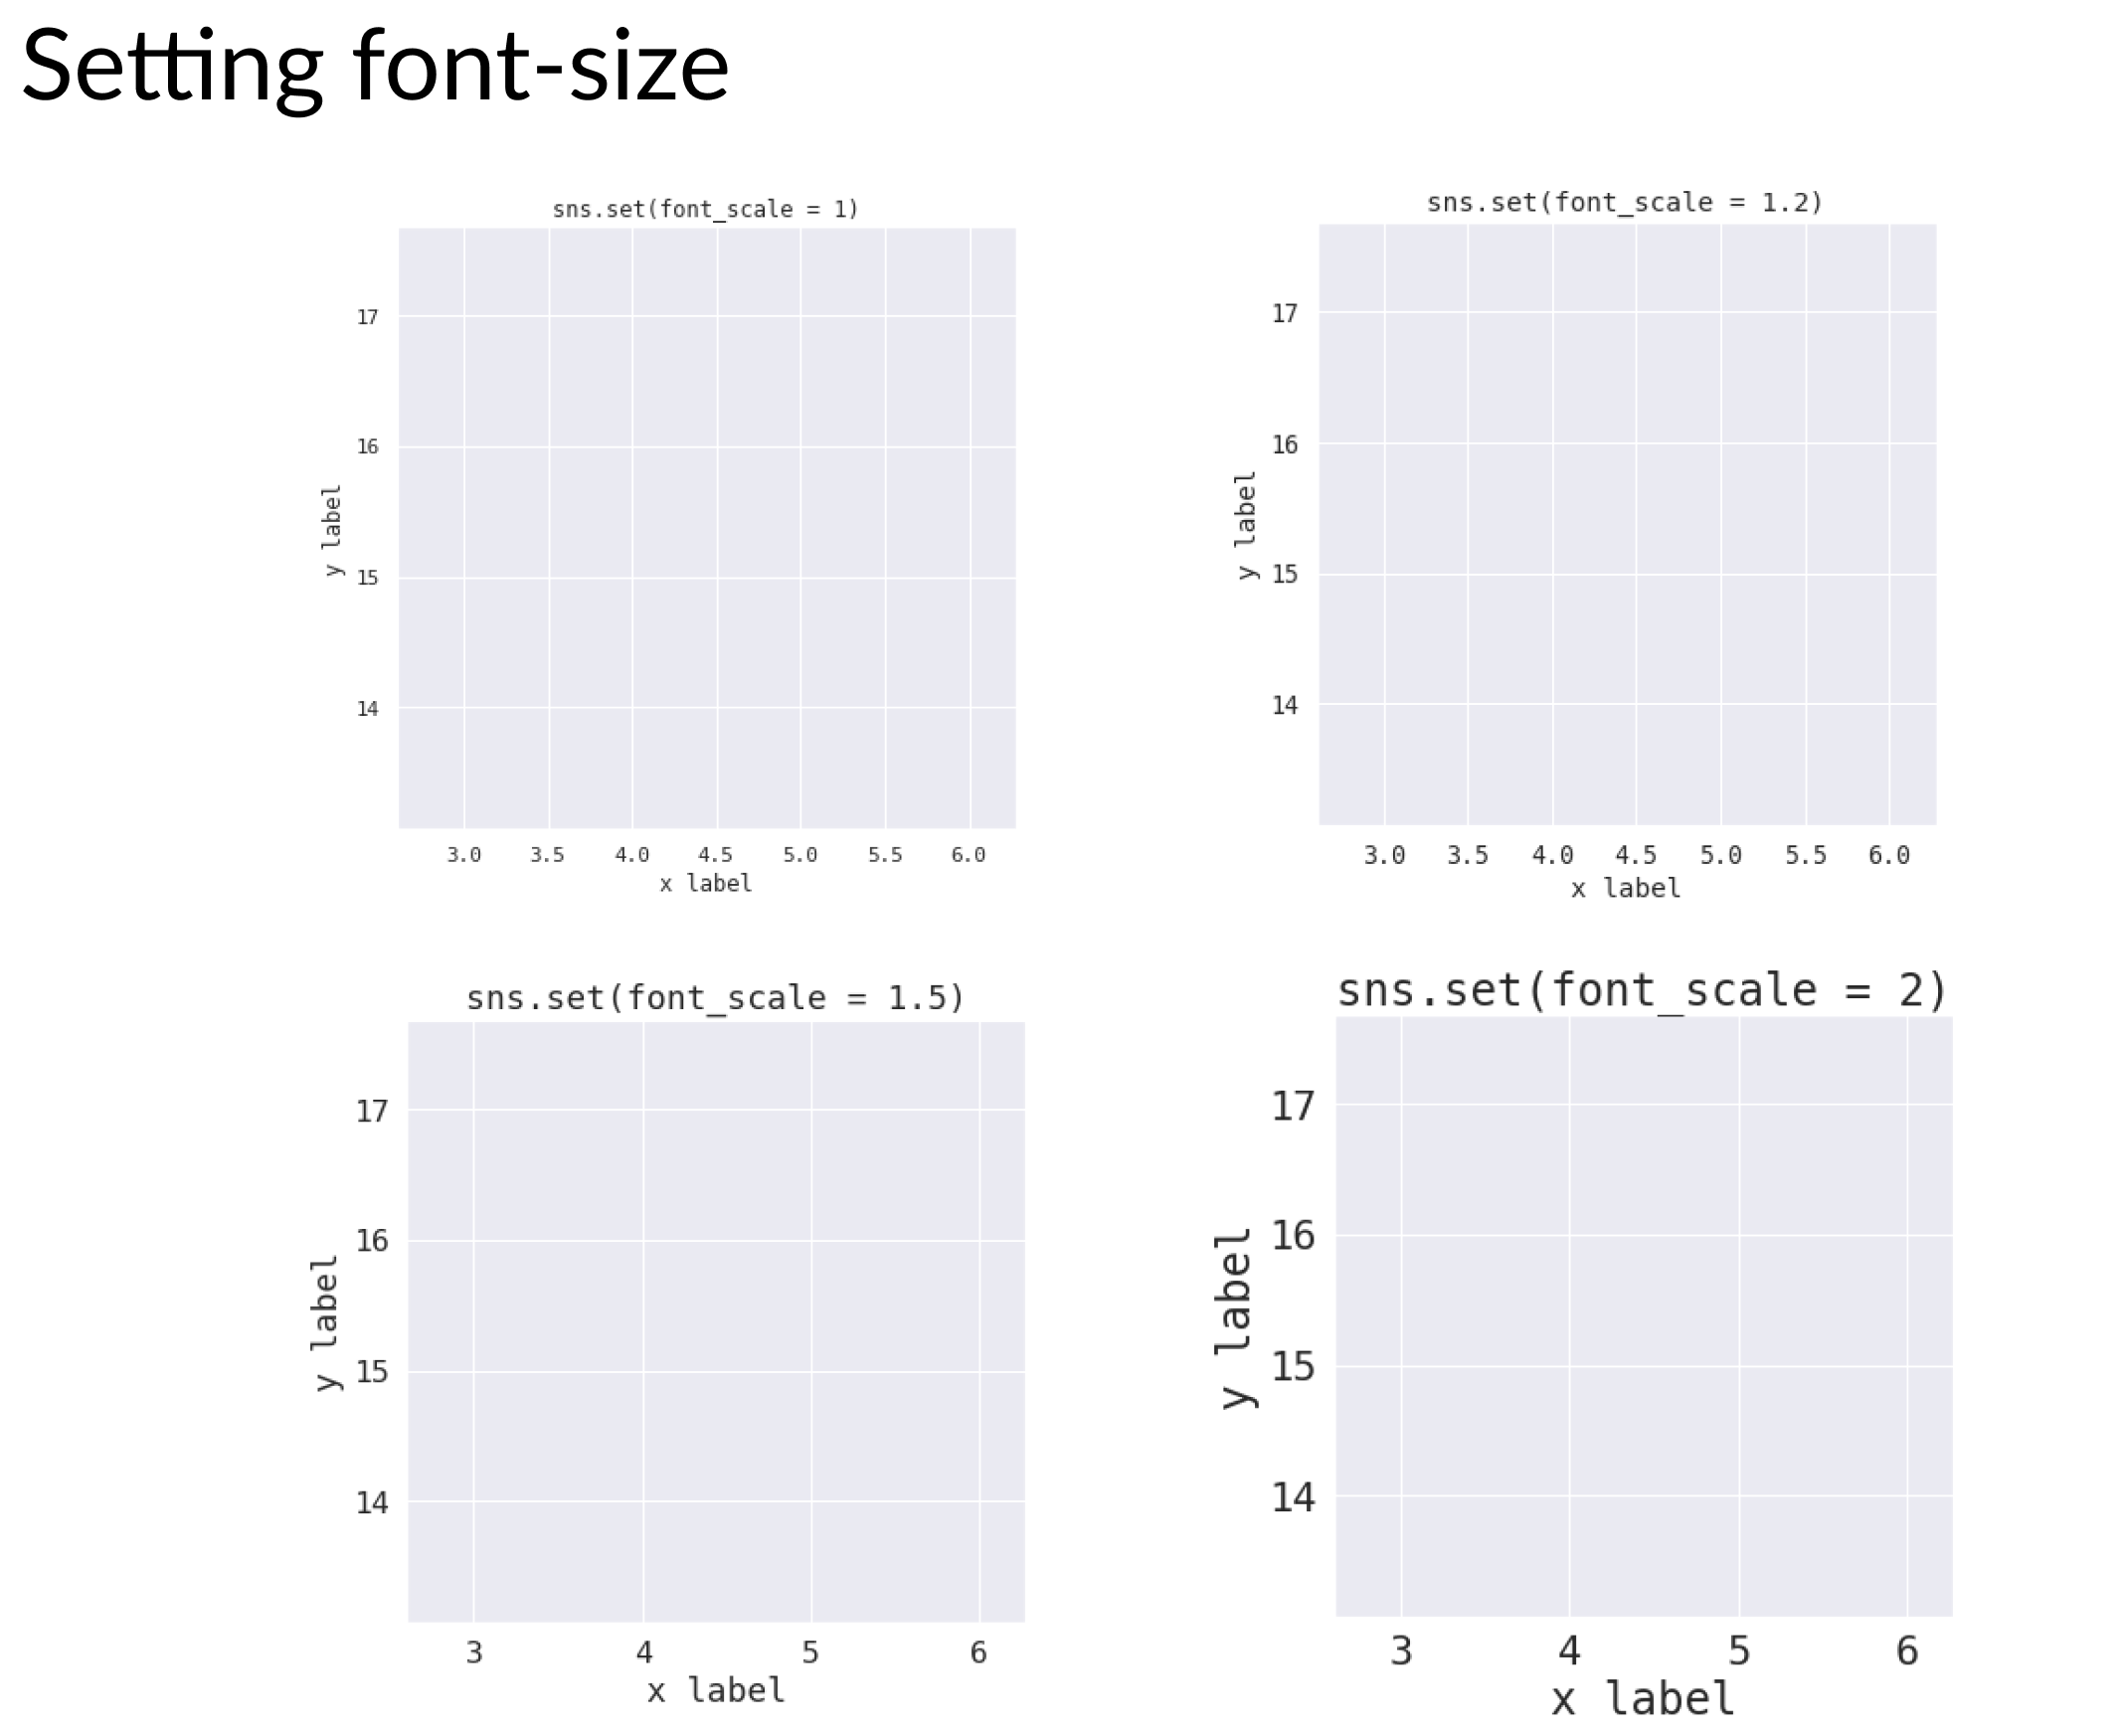
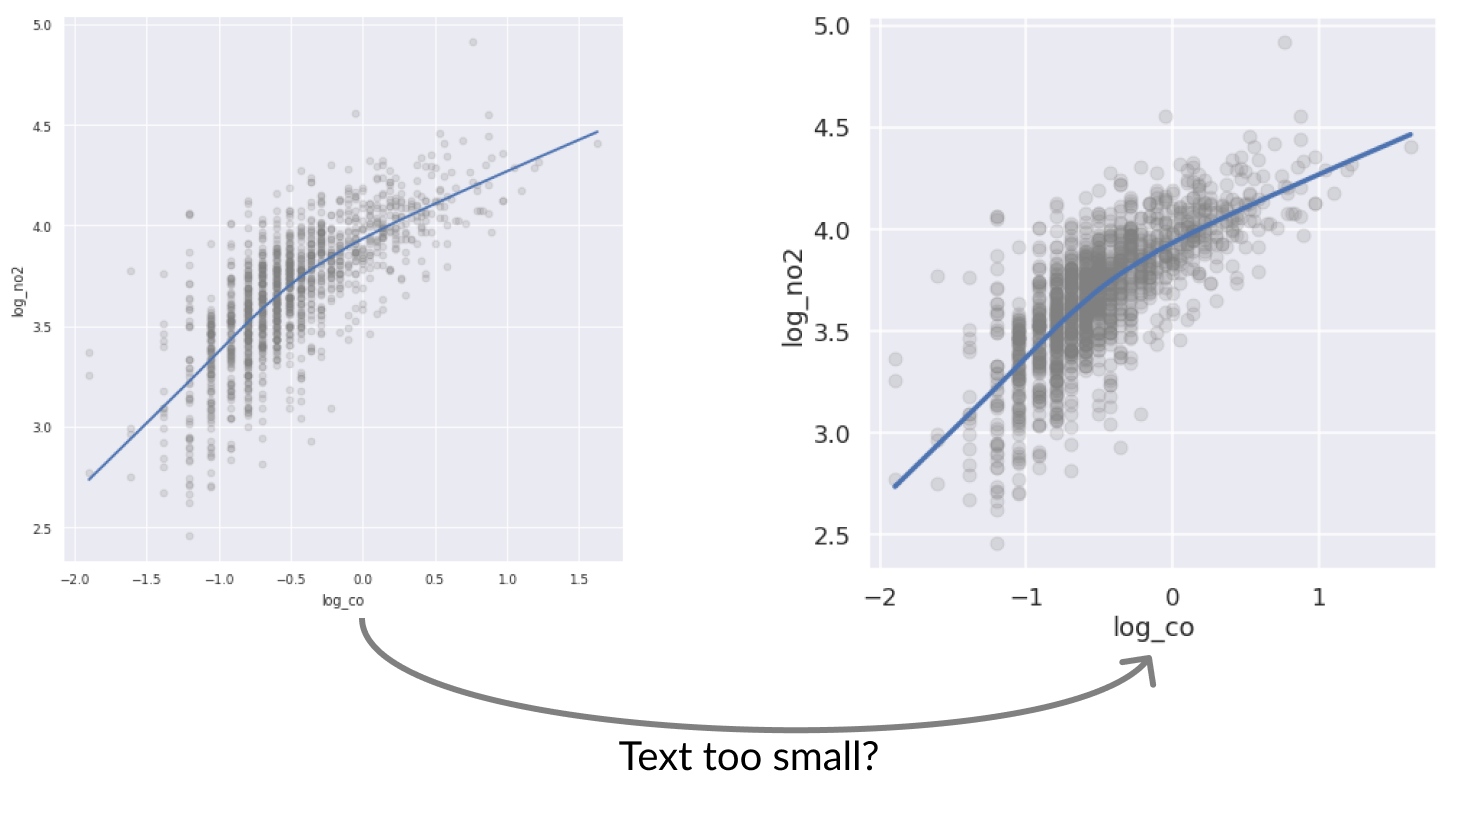
Font-sizes
- Is everything legible?
Removing spines from plots
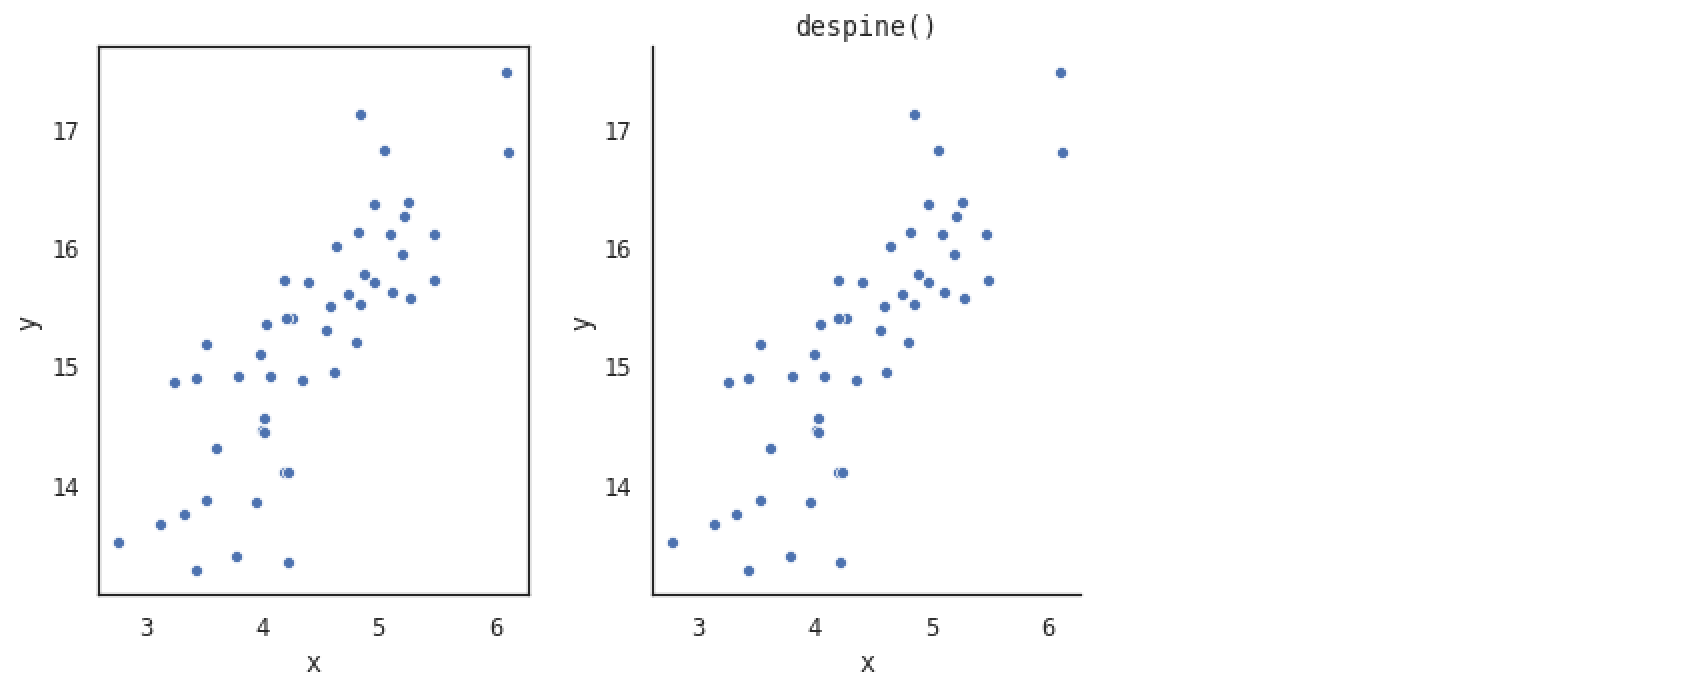
Removing spines from plots