Color in visualizations

Improving Your Data Visualizations in Python

Nick Strayer

Instructor

How color is used

  • Differentiates classes of data
  • Encodes continuous values
  • Should be used carefully

colorful ribbon

Improving Your Data Visualizations in Python

Color can be beautiful

  • Boring → eye-catching

  • Variety is good

start greyscale map compared to colorful blue map

Improving Your Data Visualizations in Python
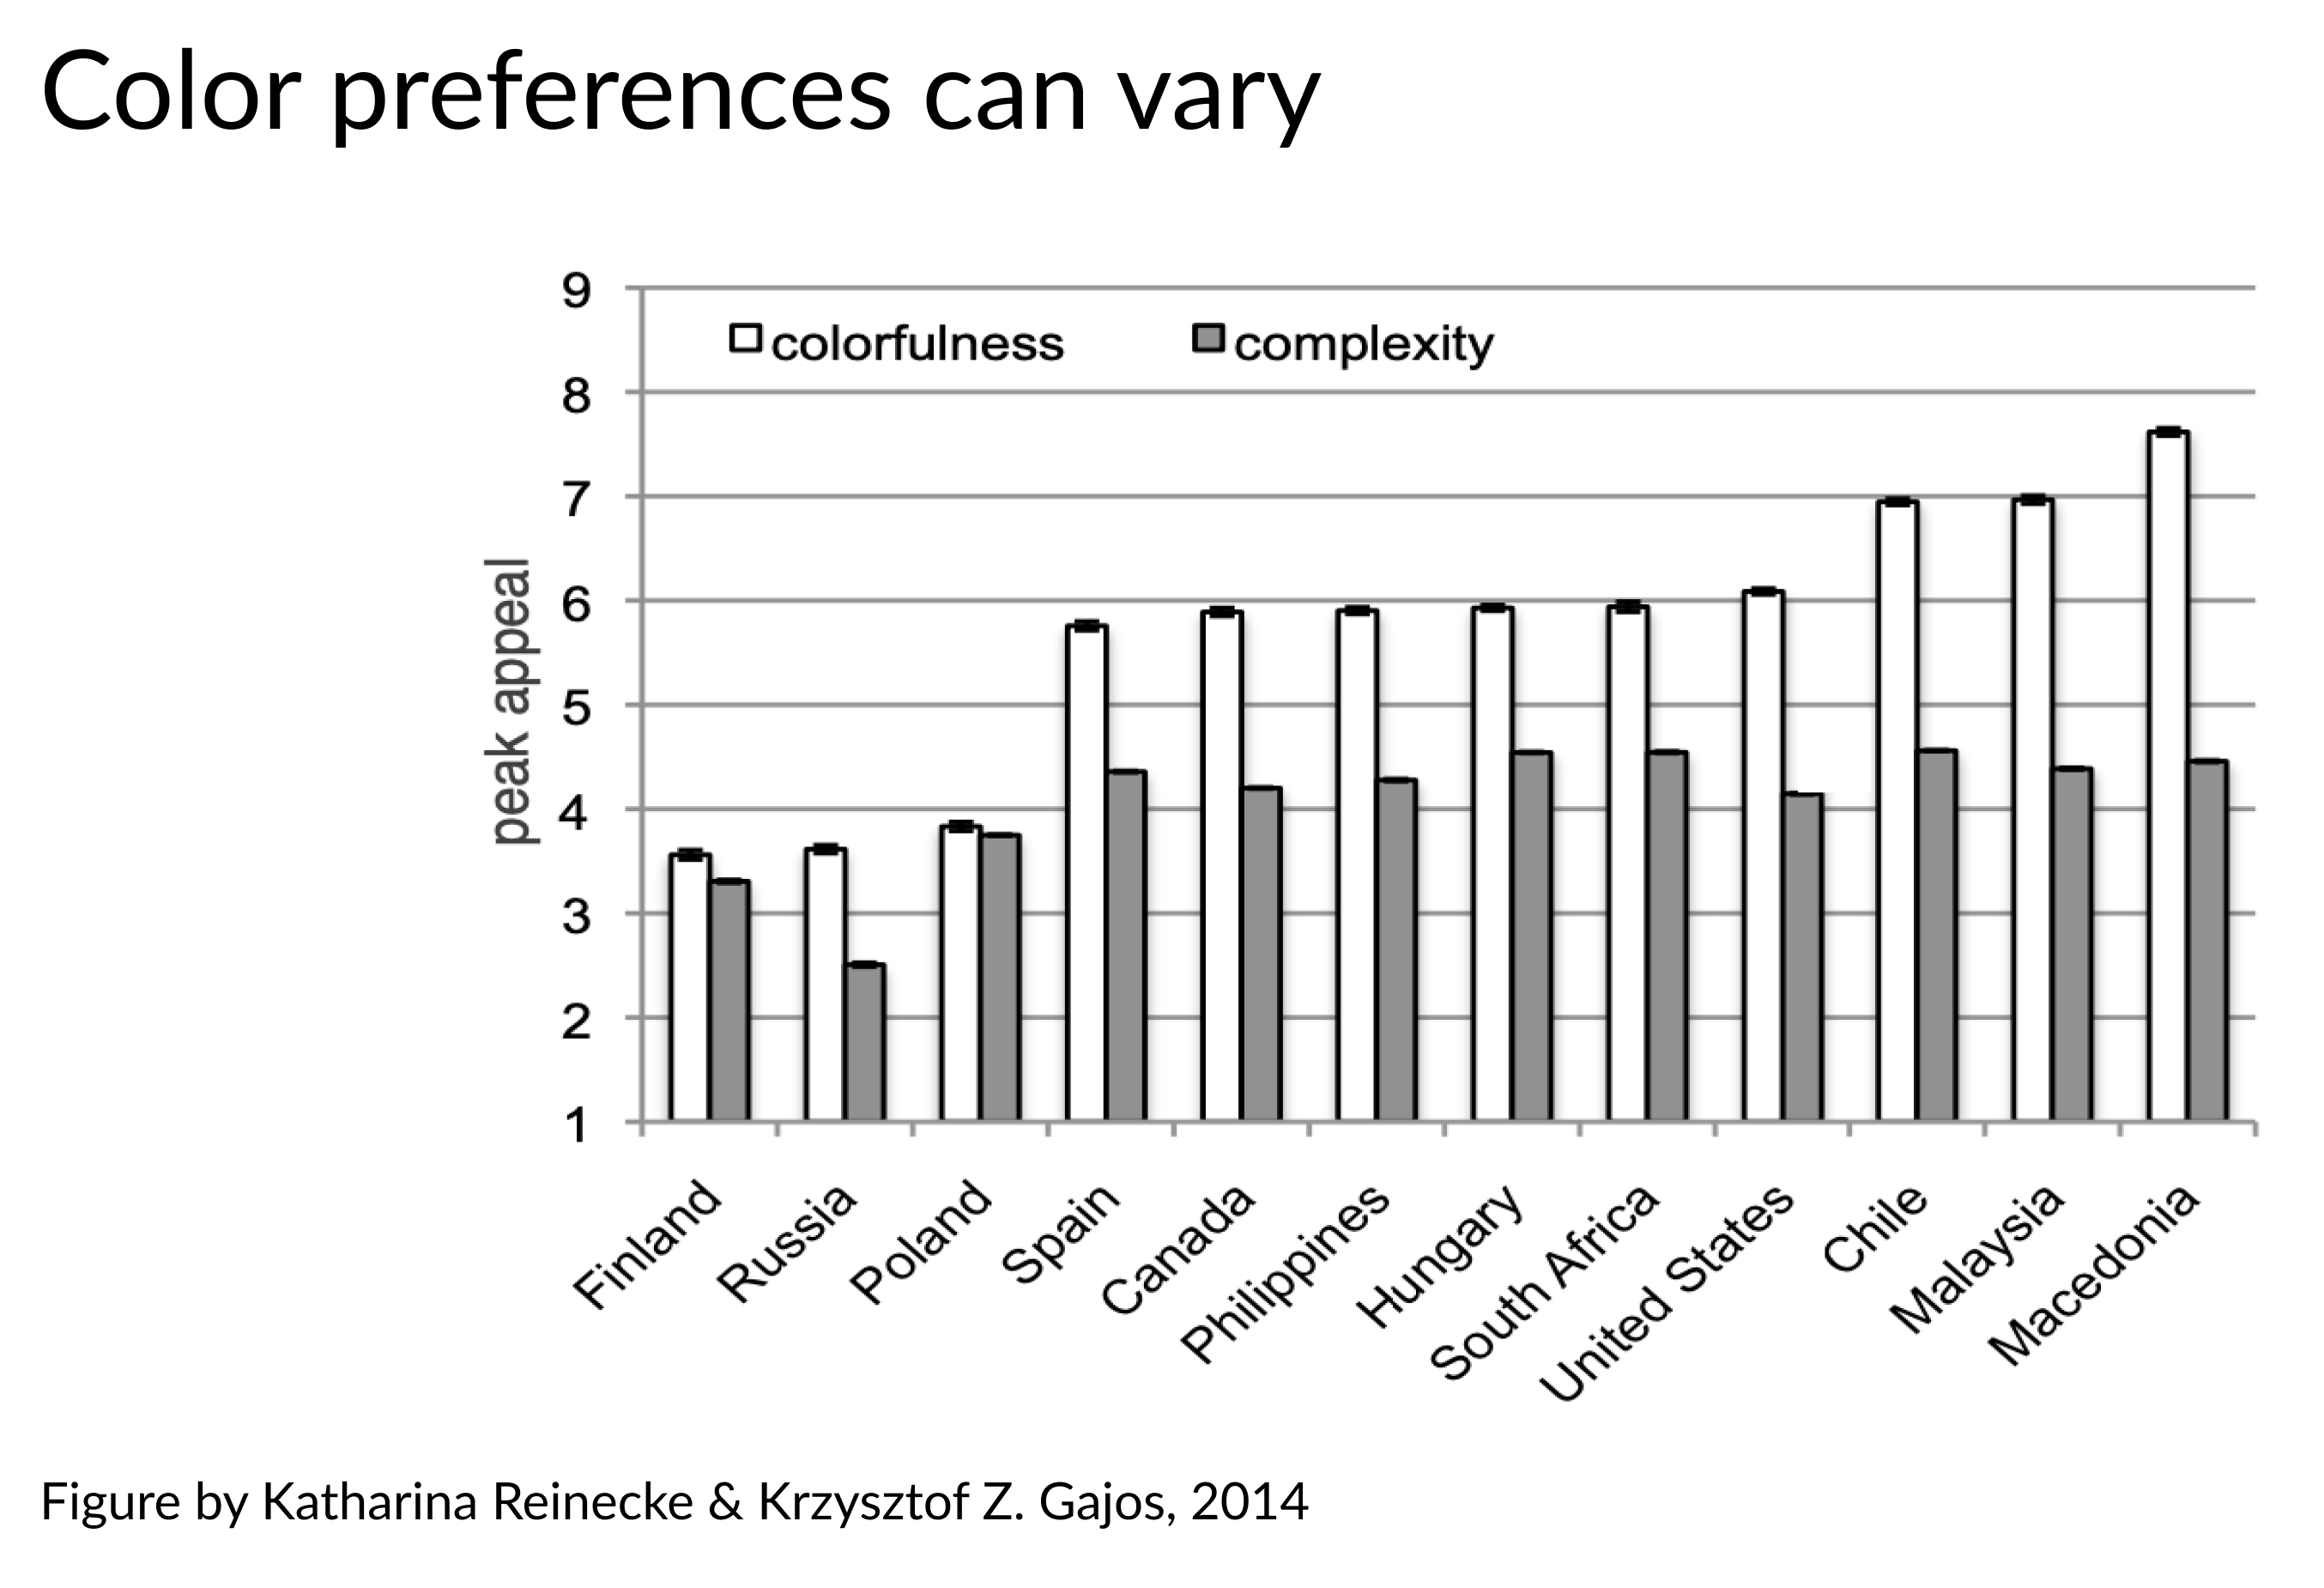
  • Meaning is often applied to colors via culture/ personal experience New York Times election map of 2016 elections
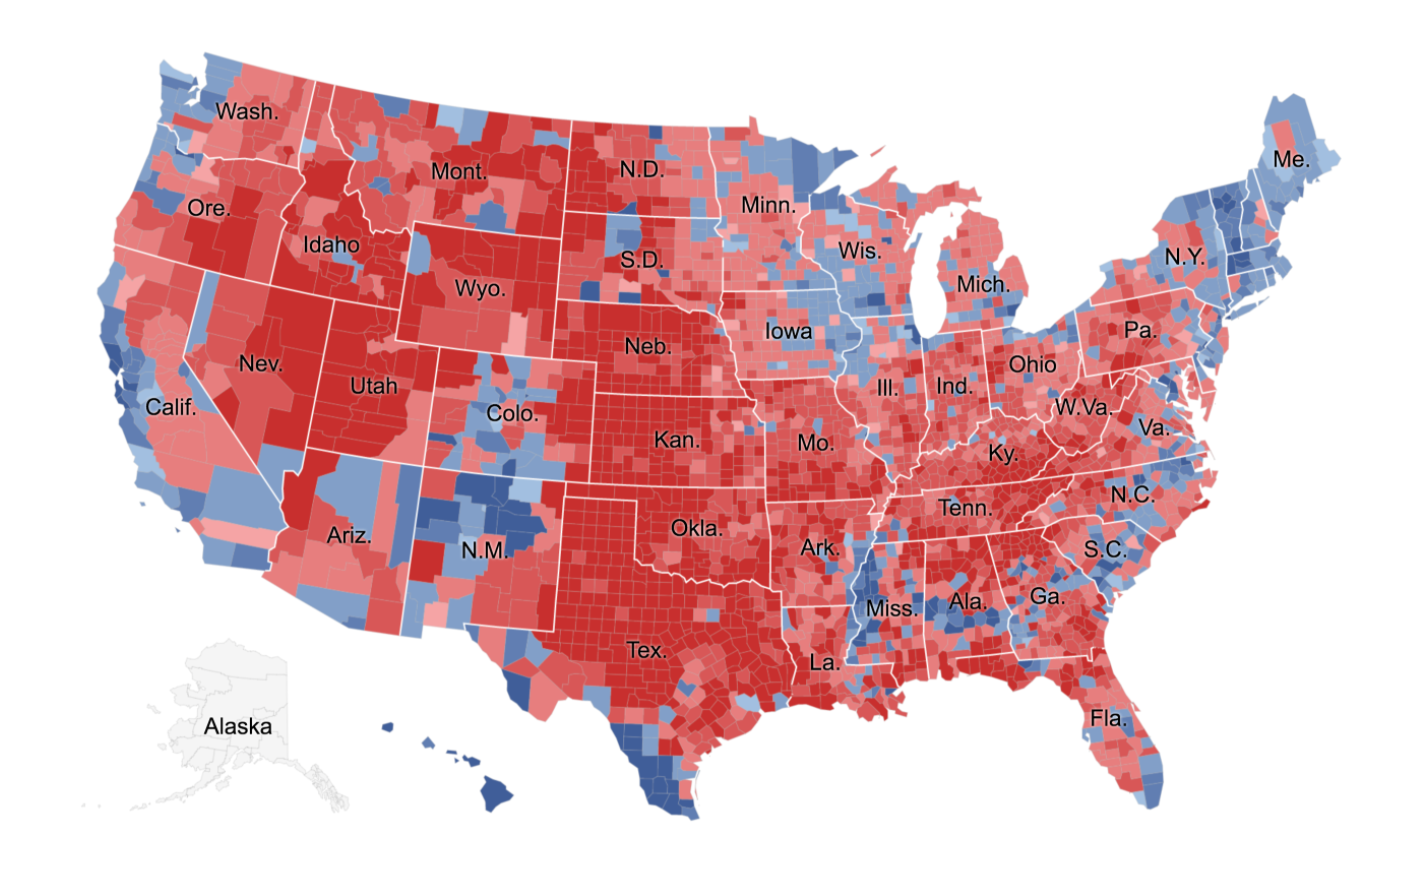
1 Parlapiano, A. (2016 November 1) There are many ways to map election results. We've tried most of them. New York Times. Retrieved from https://www.nytimes.com/
Improving Your Data Visualizations in Python

Bar chart showing how color preferences vary

Improving Your Data Visualizations in Python

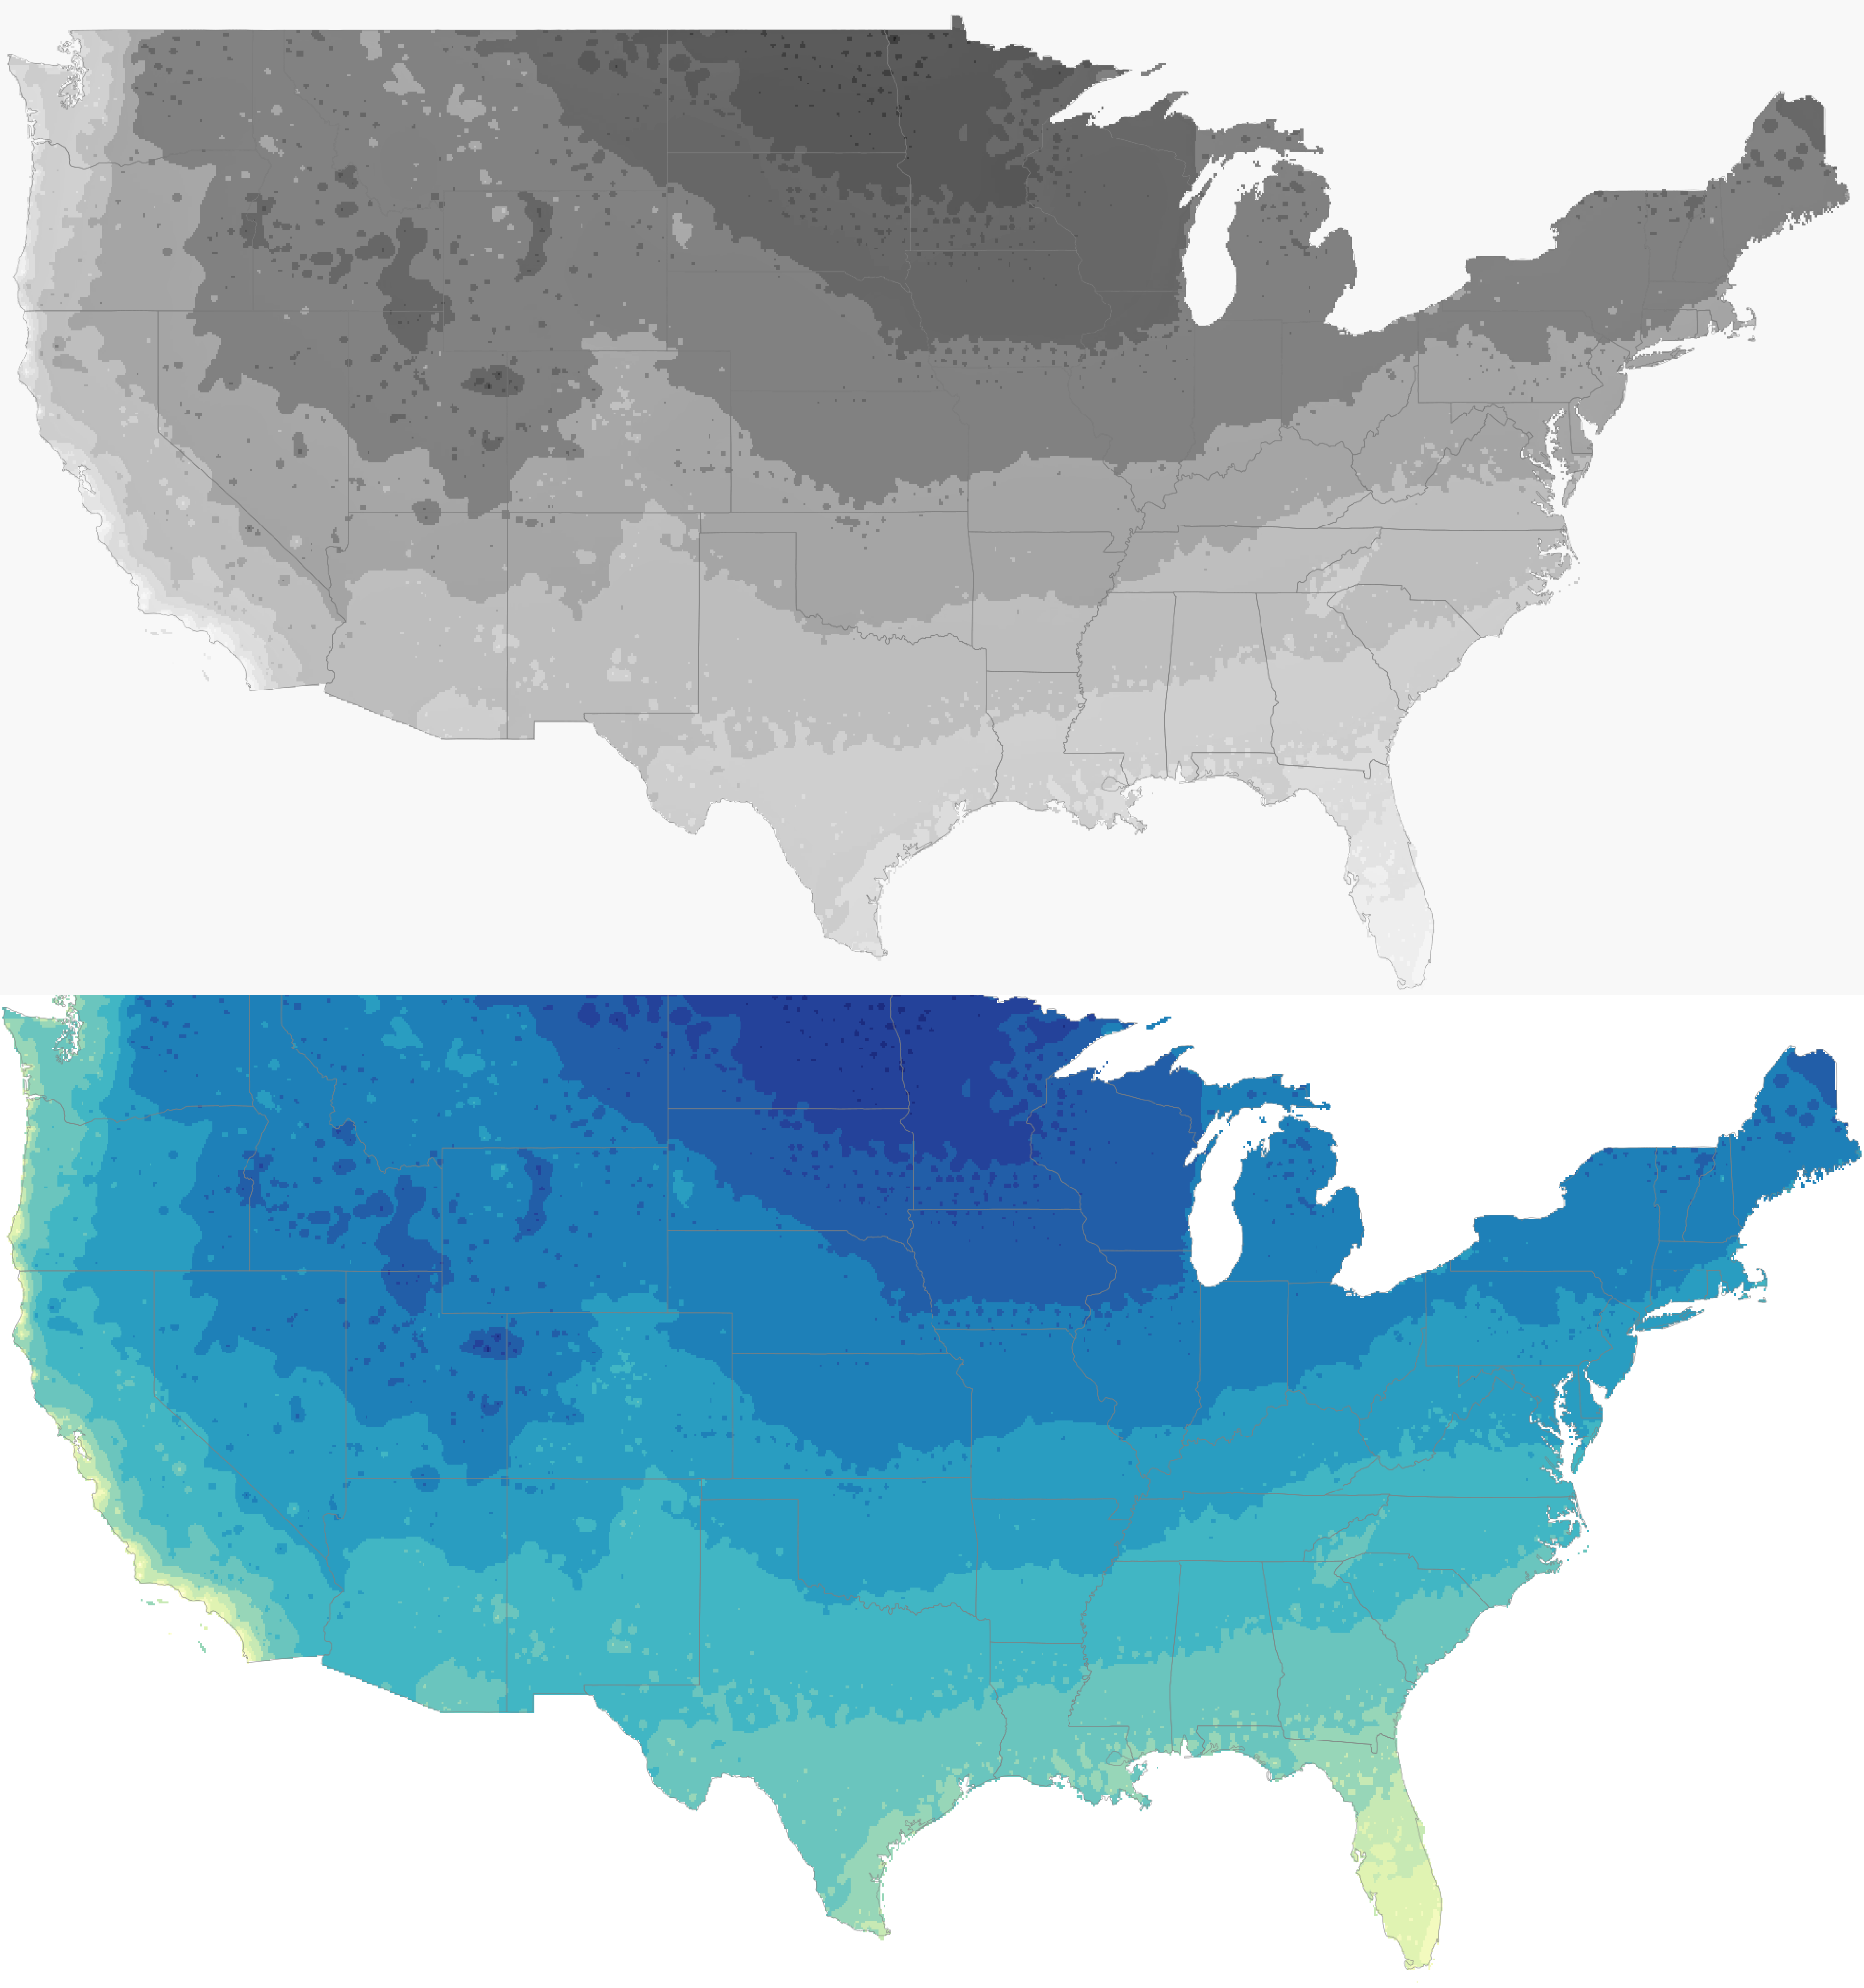
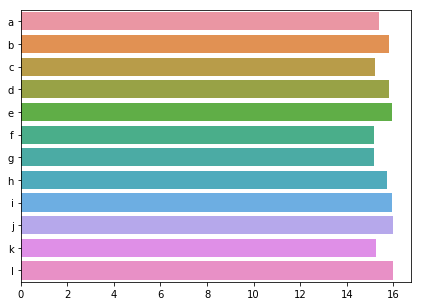
Color can be misleading...

"It is evident that the color-size illusion is present in a marked degree [no matter what] arrangement."

C.J. Warden & E.L. Flynn, 1926

Cartons of varying sizes and colors

Improving Your Data Visualizations in Python

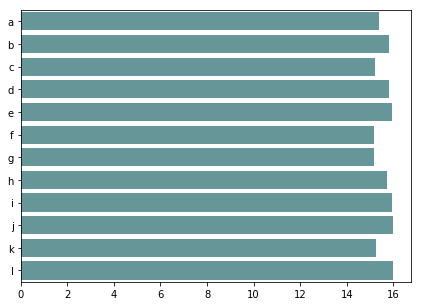
A remedy for the color-size illusion

sns.barplot(x = values, y = ids)

  rainbow colored bar chart with no borders

sns.barplot(x = values, y = ids, 
            edgecolor = 'black')

raibow colored bars with black outlining bars

Improving Your Data Visualizations in Python
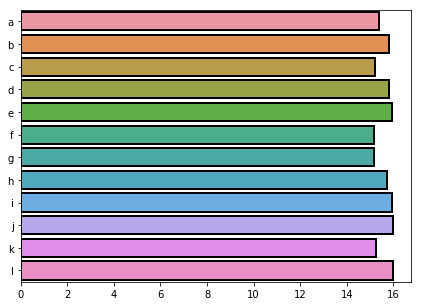
sns.barplot(x = values, y = ids, color = 'cadetblue')

bar chart with all blue bars

Improving Your Data Visualizations in Python

Let's paint some data!

Improving Your Data Visualizations in Python

Preparing Video For Download...