Visualizing the price evolution
Financial Analytics in Google Sheets

David Ardia
Professor in Quantitative Methods for Finance
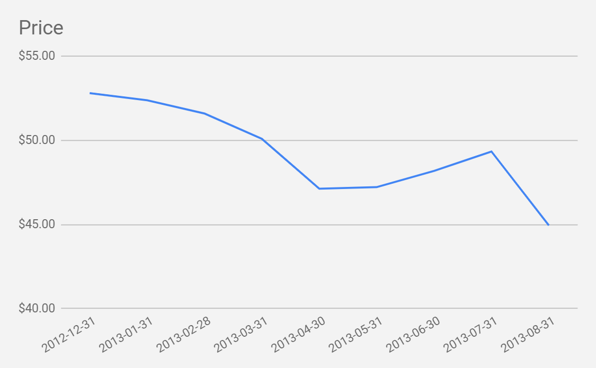
Line chart
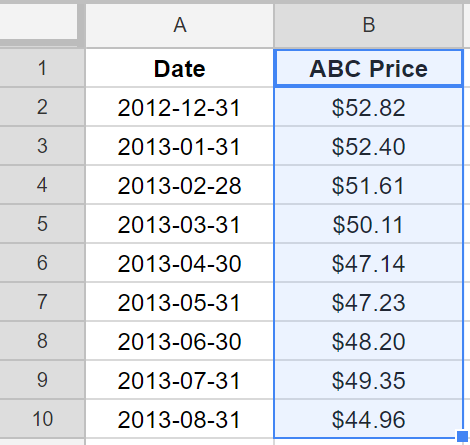
Historical prices are points
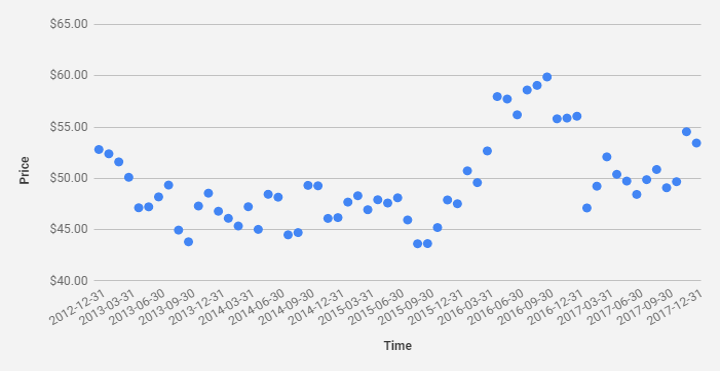
Line chart
Connecting the points...
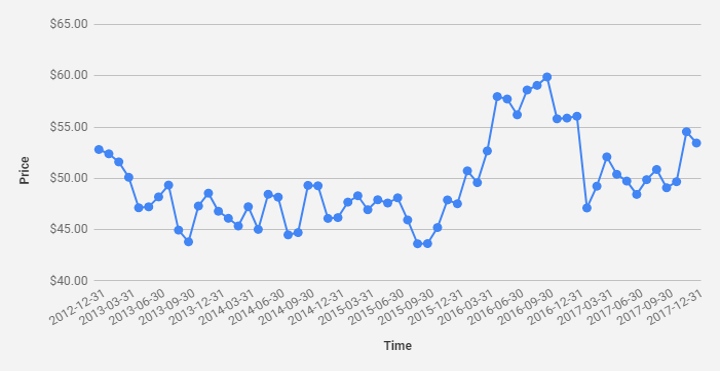
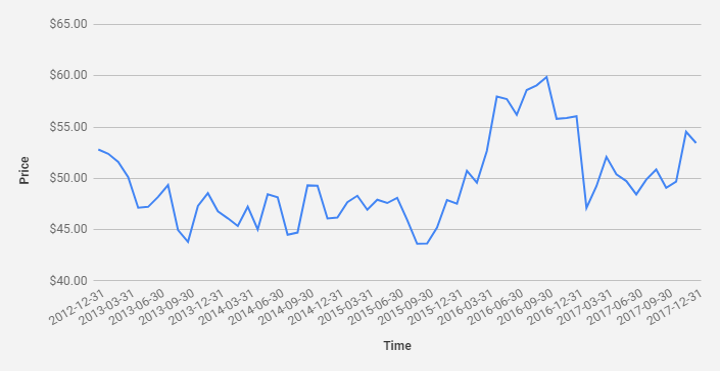
Line chart
...leads to a line chart.
Building a line chart
Step 1: Select range of past prices
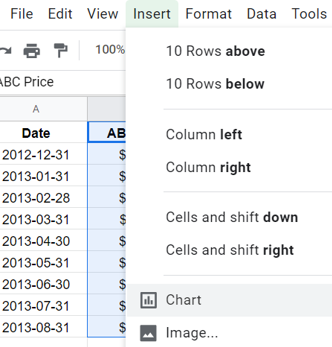
Step 2: Click on Insert >> Chart
Building a line chart
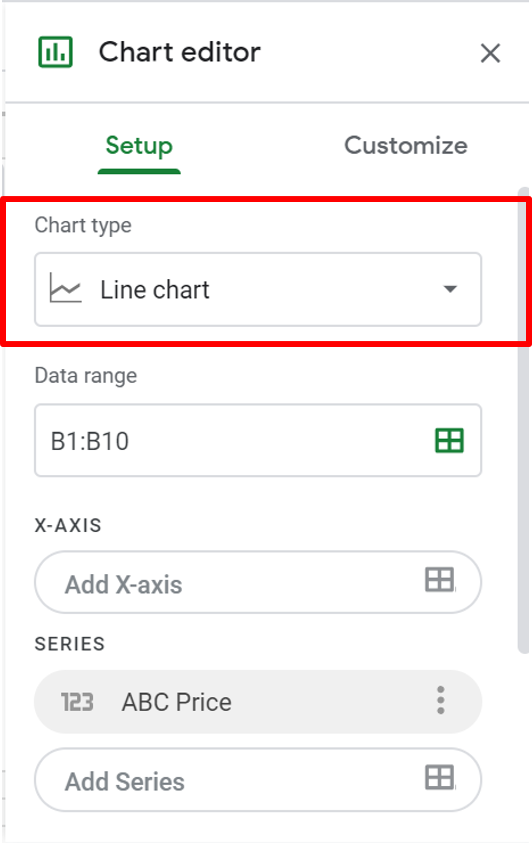
Step 3: Select Line chart
And you're done!
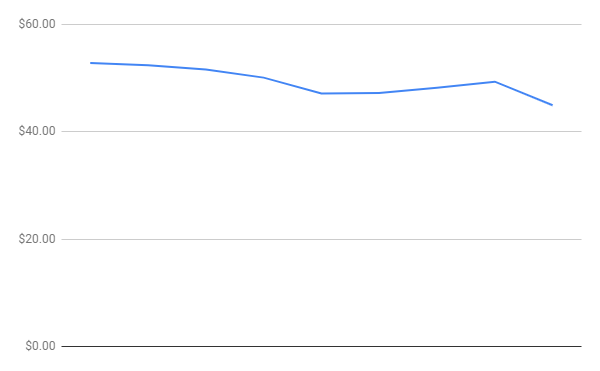
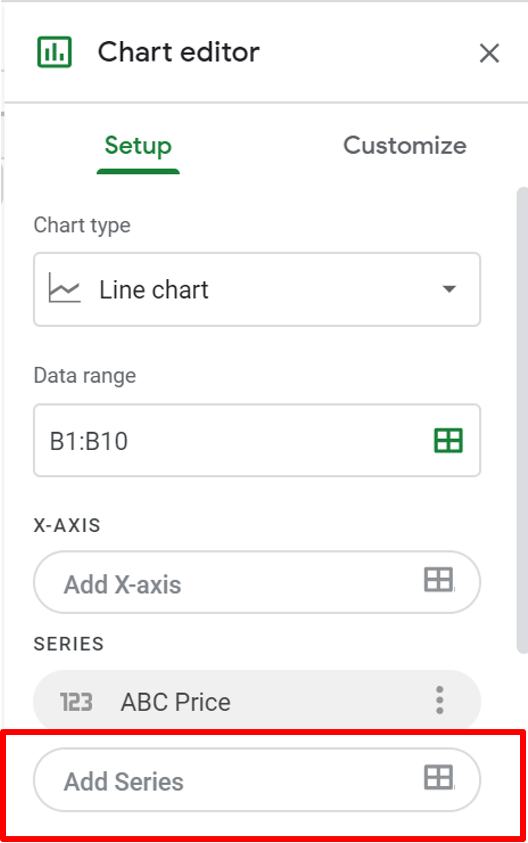
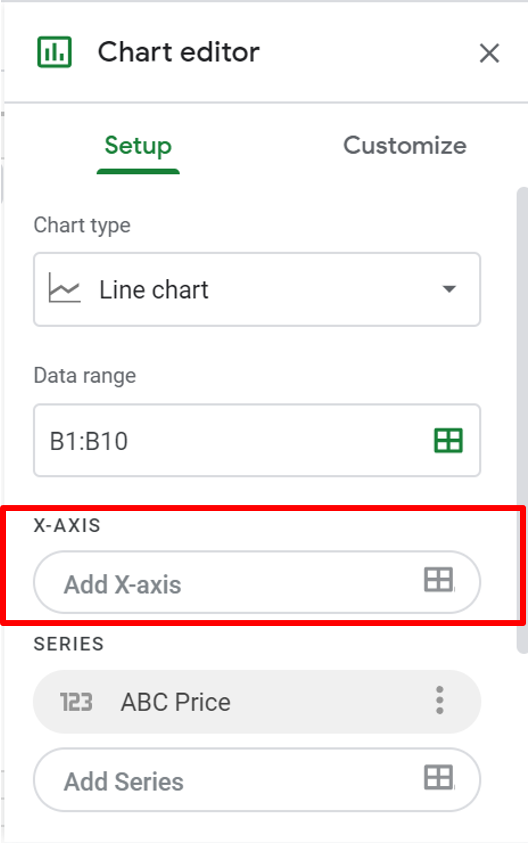
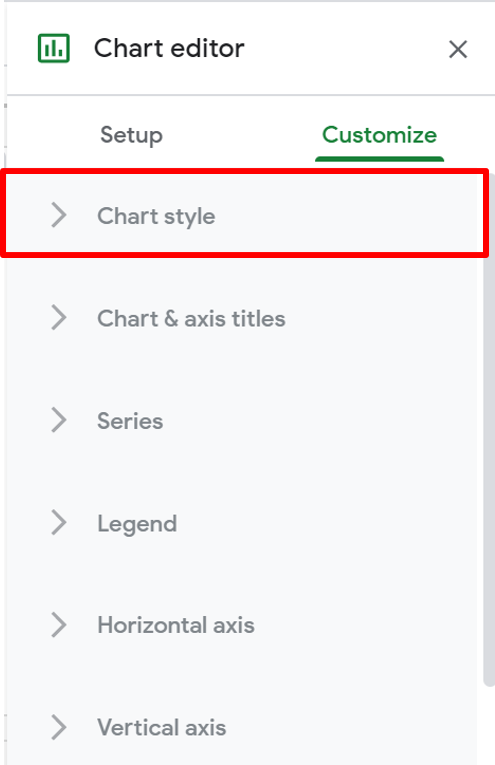
Chart editor
Add series to the chart
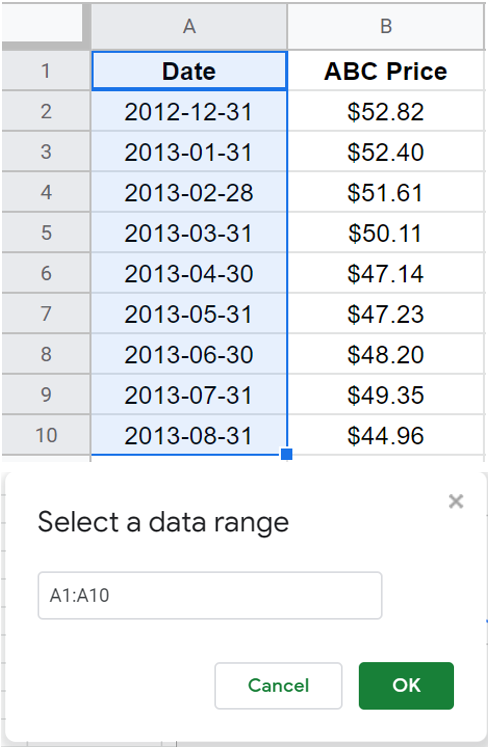
Add the horizontal axis
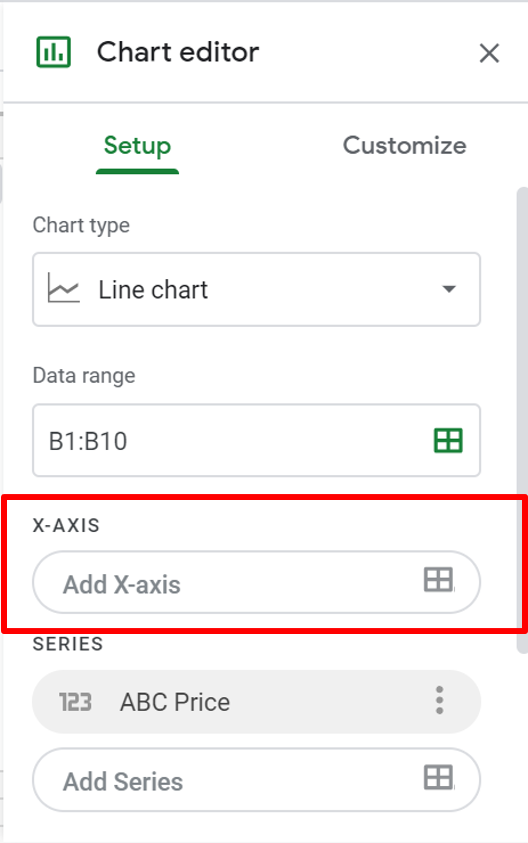
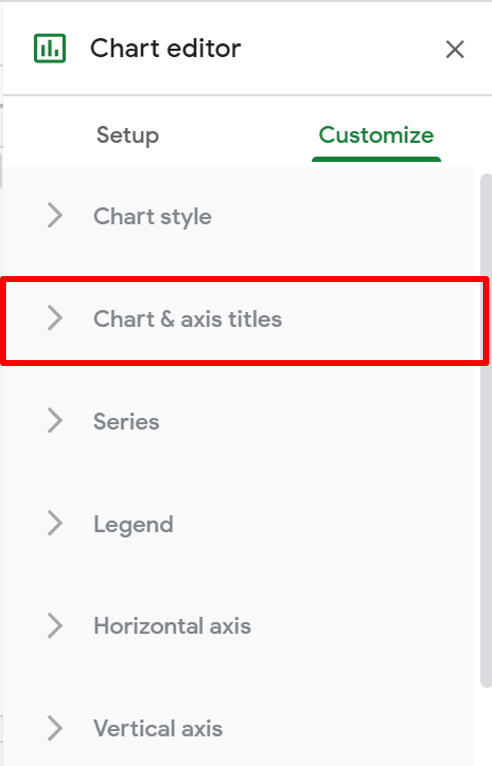
Chart editor
Modify the titles
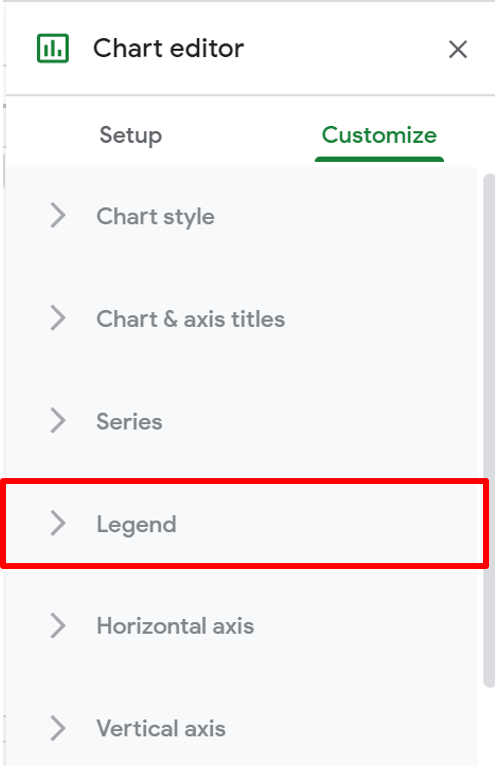
Modify the legend
Improving a line chart
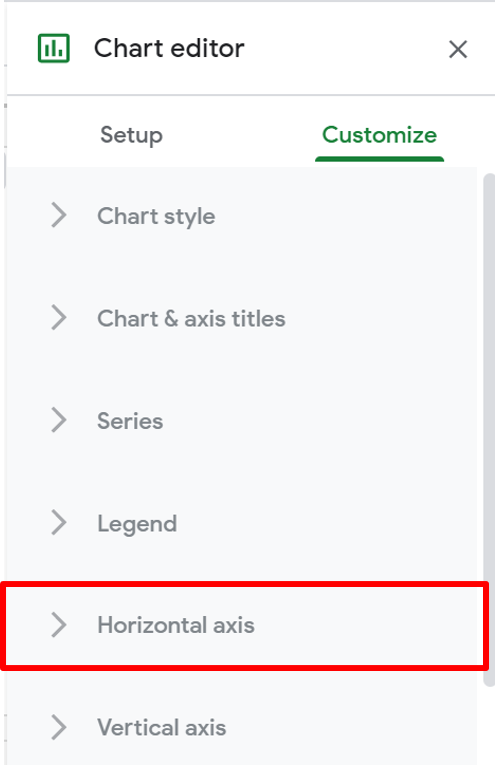
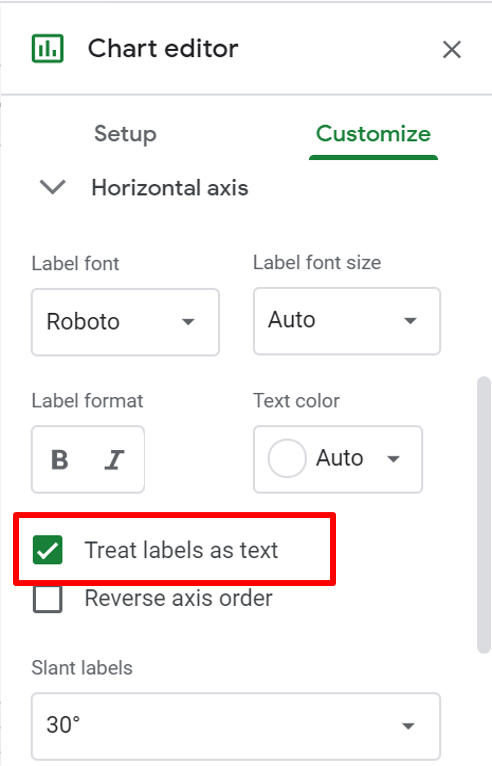
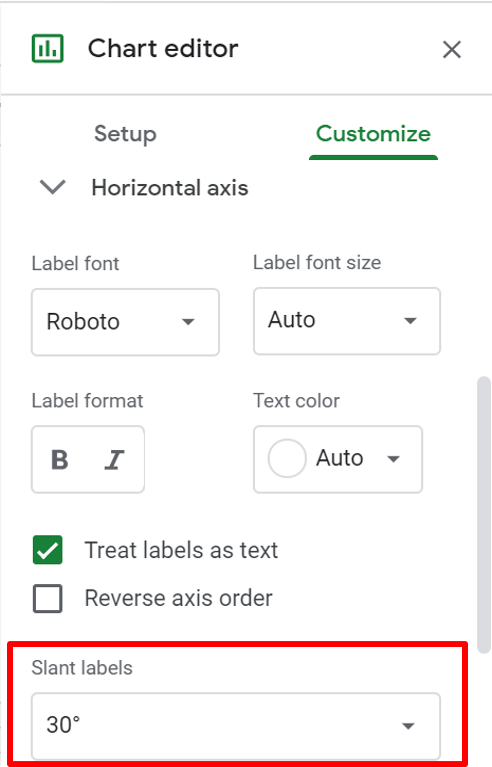
Adding dates on the horizontal axis
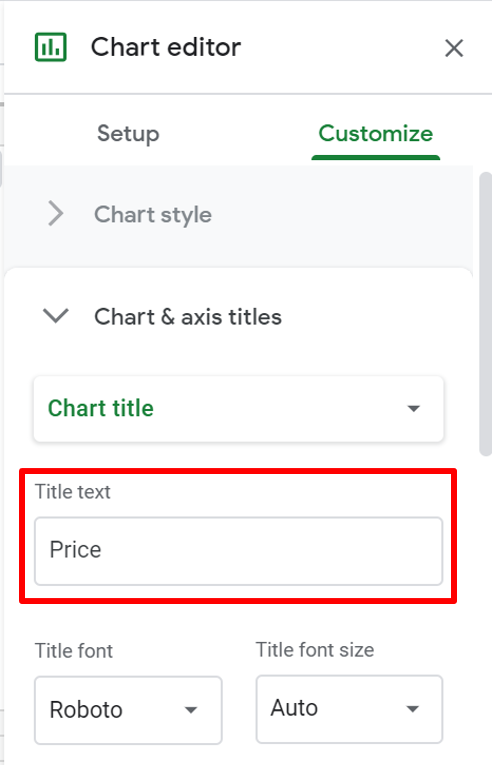
Modifying the title
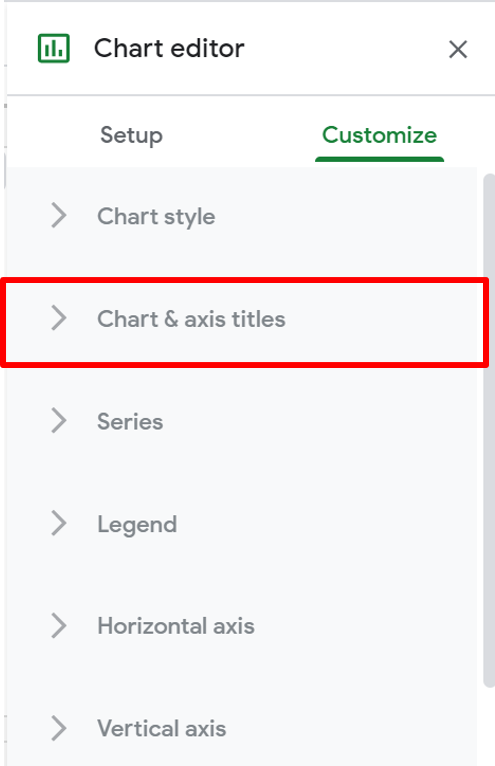
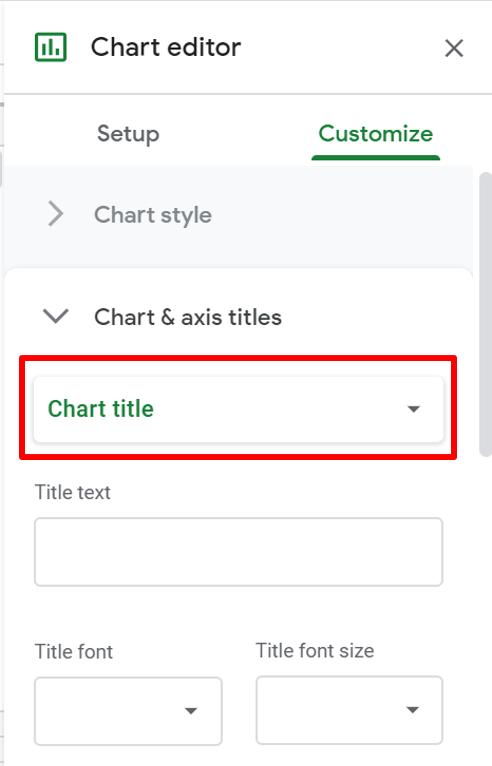
Modifying the title
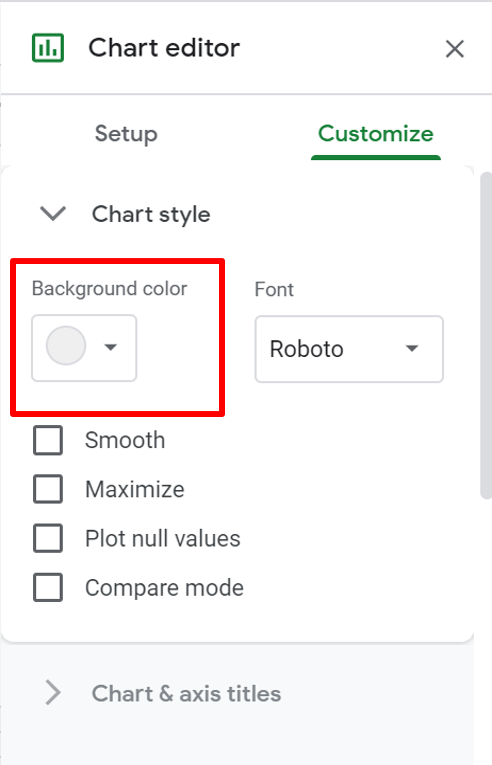
Changing the background color
Modifying the axes
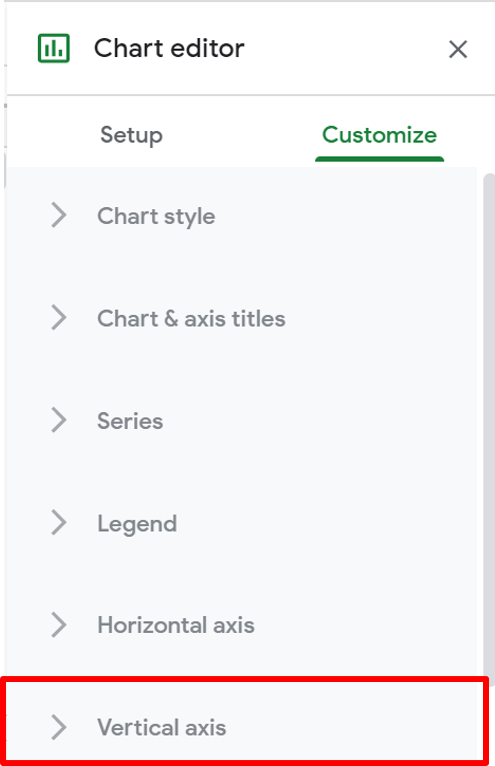
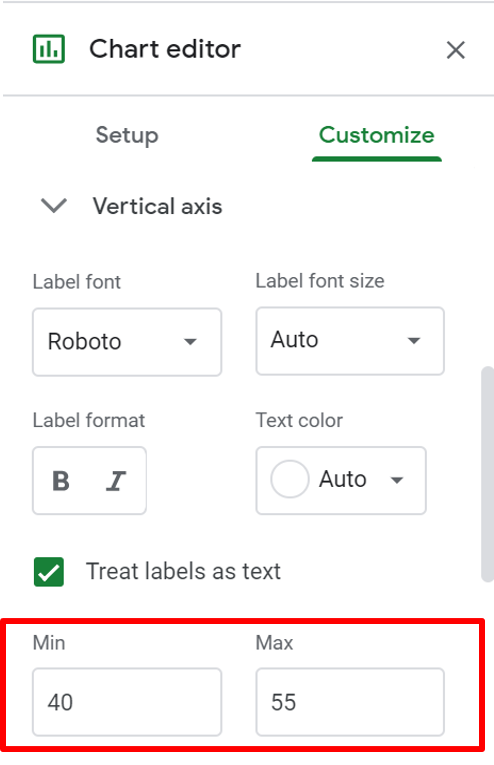
Modifying the axes
Modifying the axes
Before...
...After