Histogram of stock returns
Financial Analytics in Google Sheets

David Ardia
Professor of Quantitative Methods for Finance
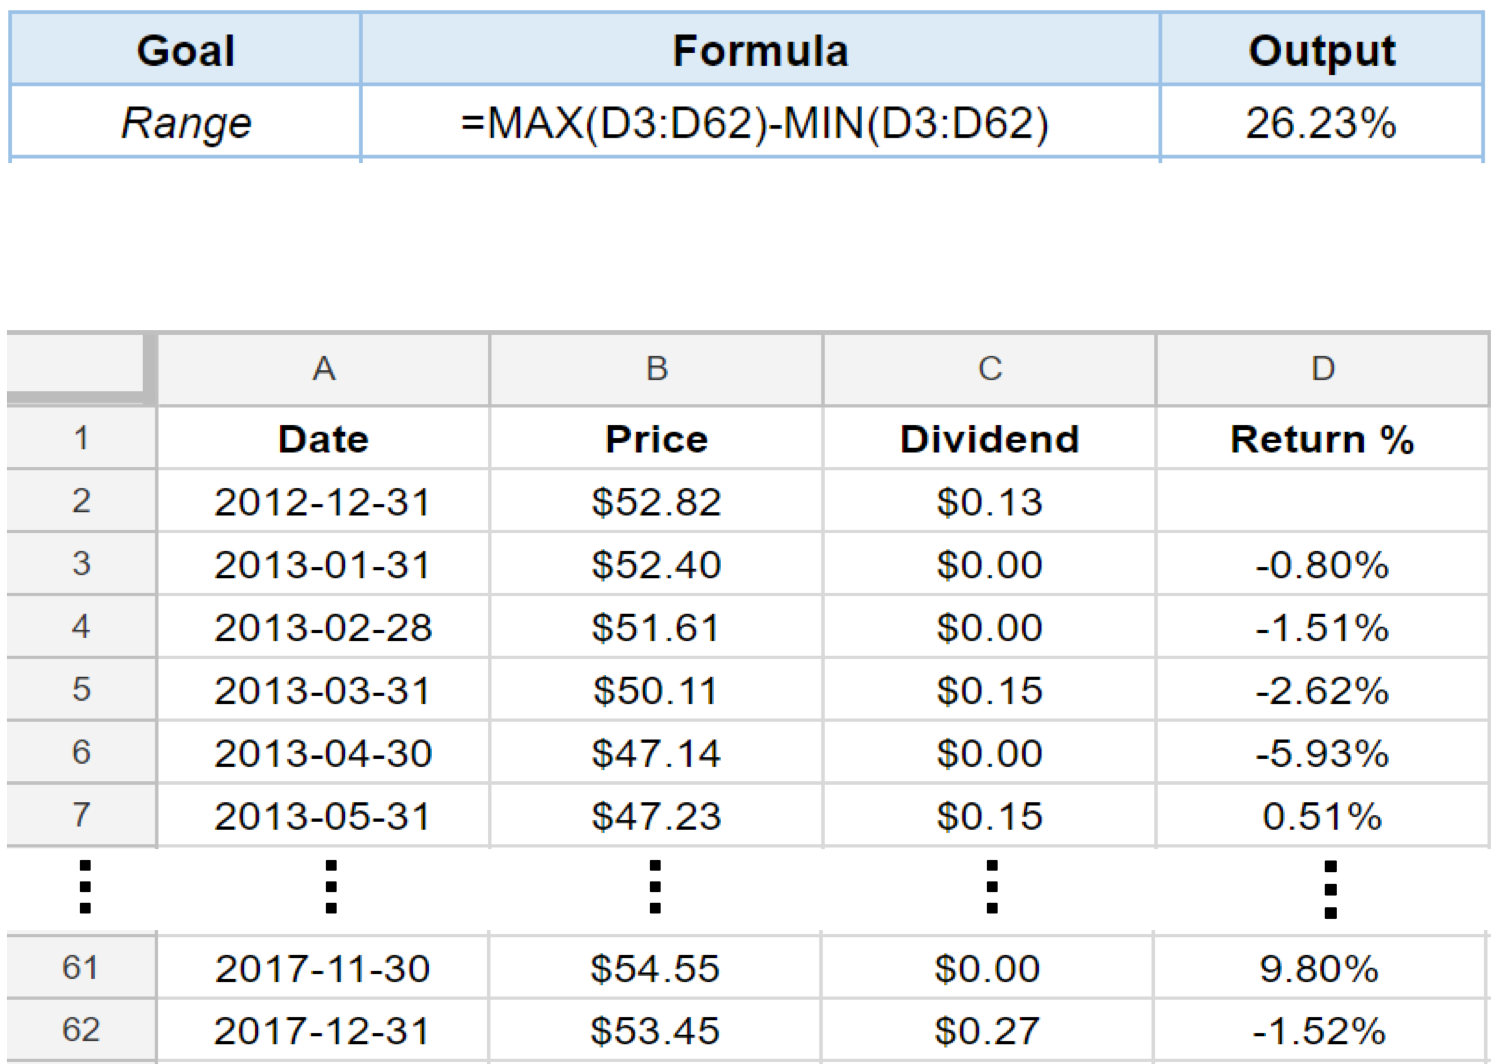
Histogram of historical returns
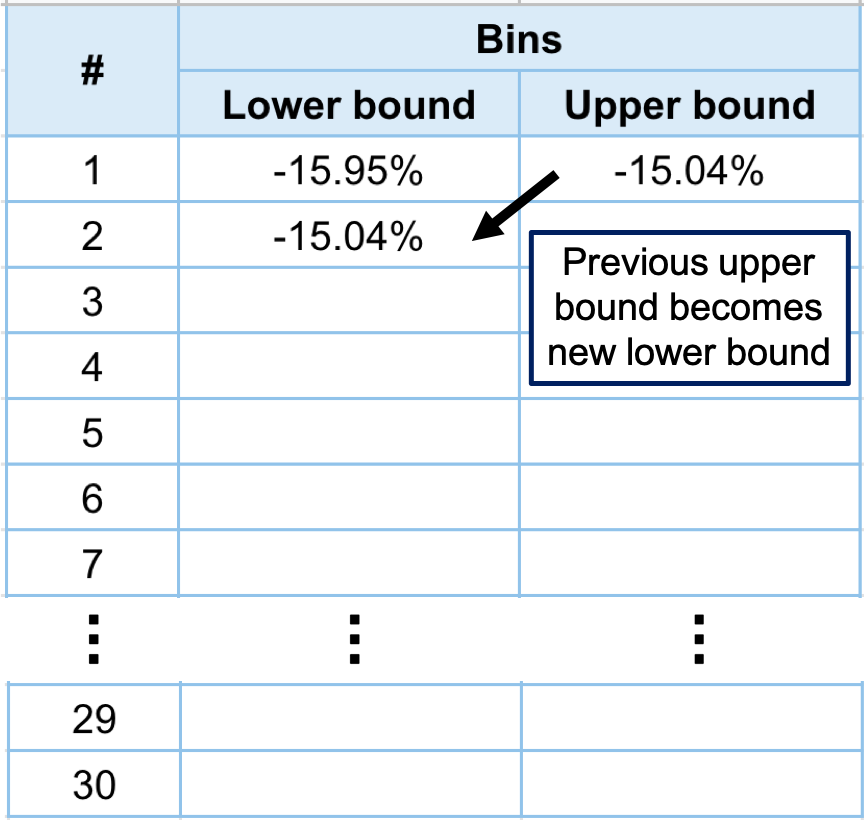
Histogram of historical returns: bins
1) Divide the range of returns into bins
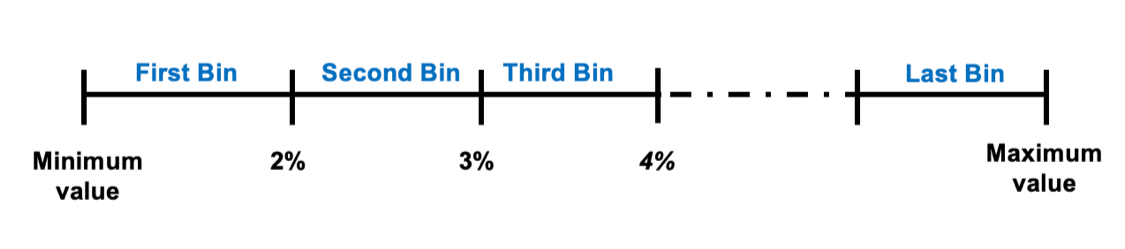
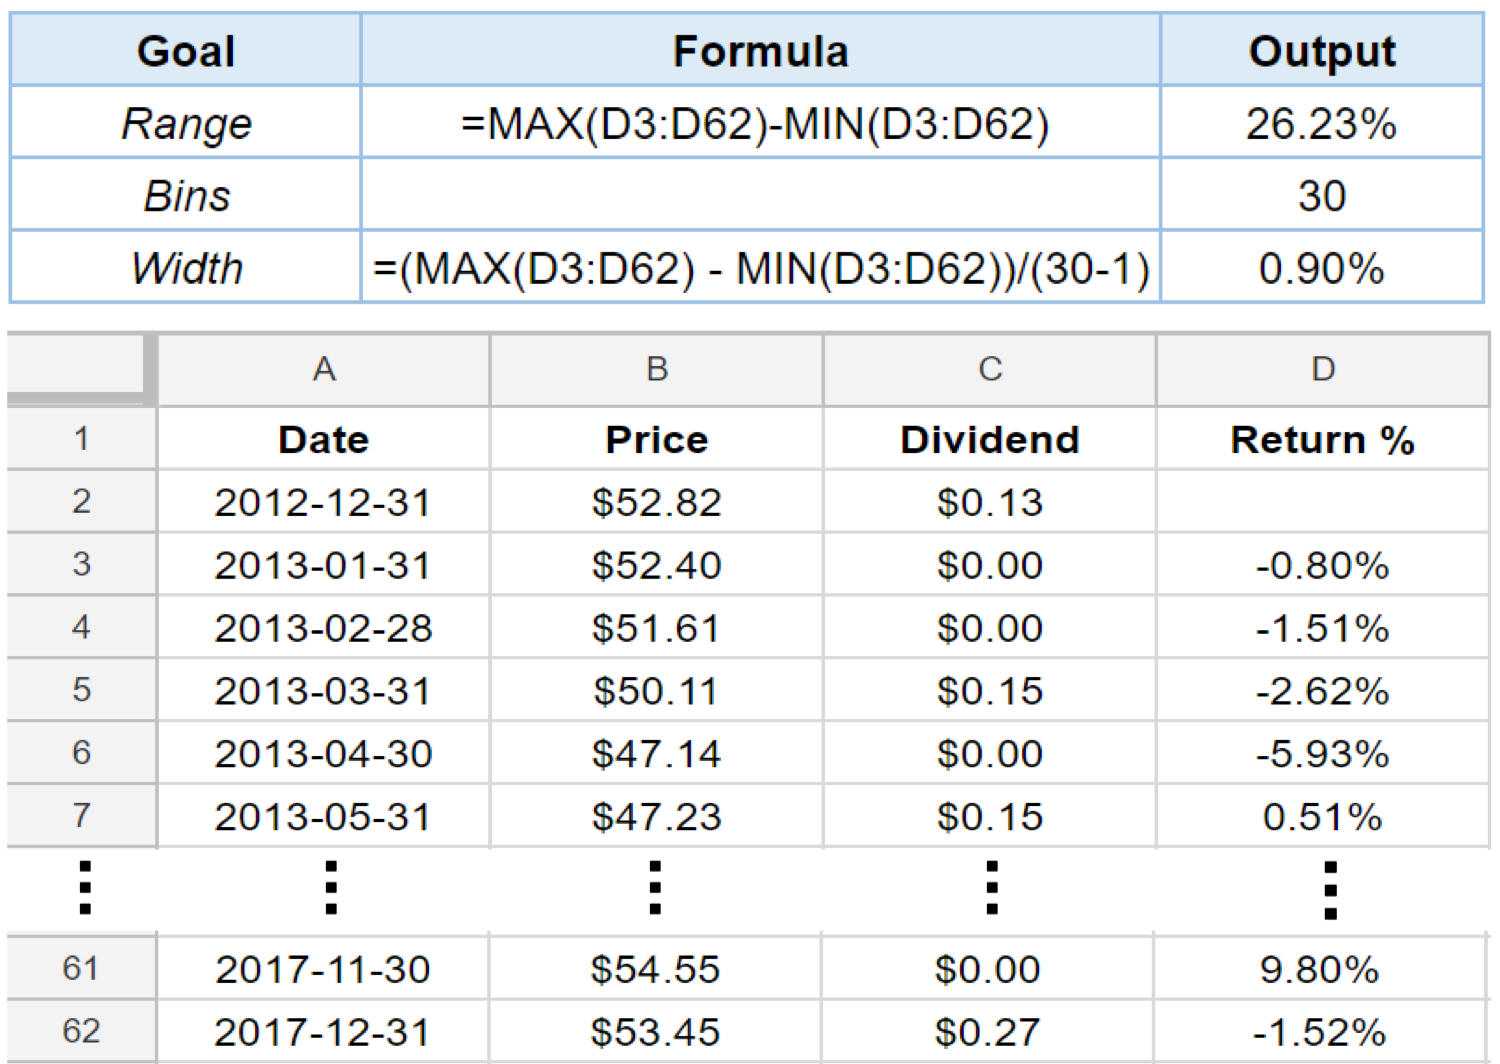
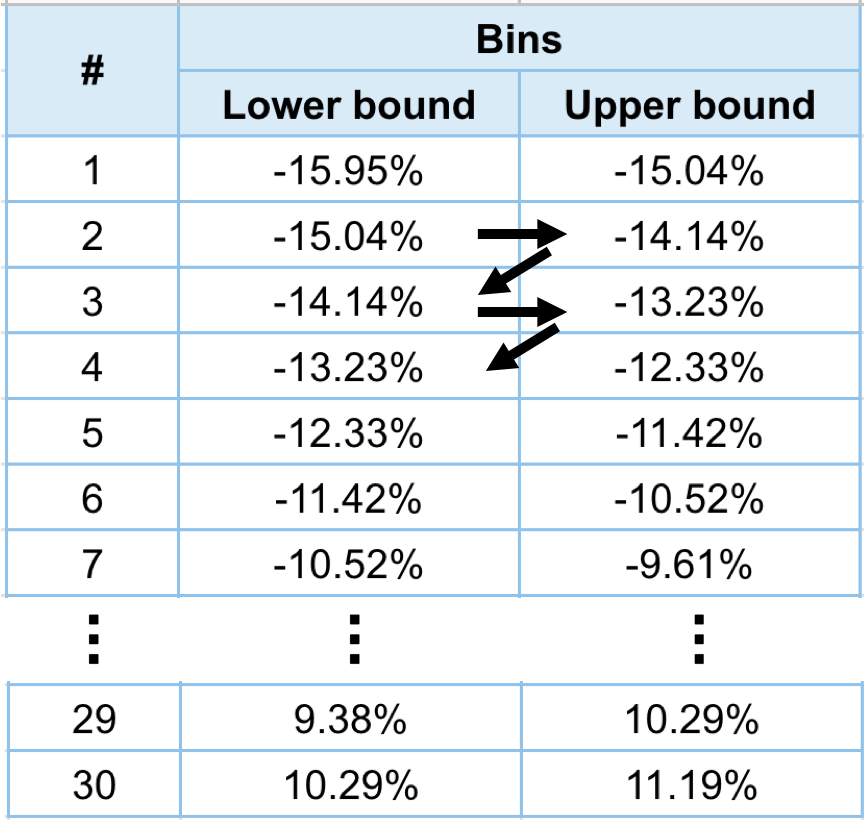
Histogram of historical returns: bins
1) Divide the range of returns into bins
Histogram of historical returns: bins
1) Divide the range of returns into bins
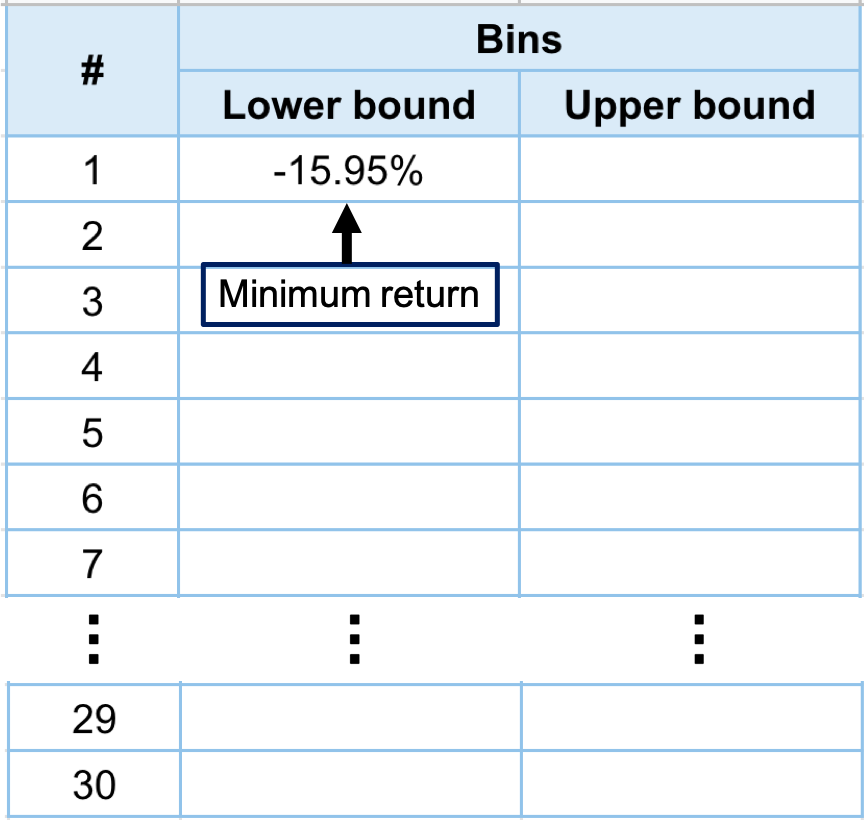
Histogram of historical returns: bins
1) Divide the range of returns into bins
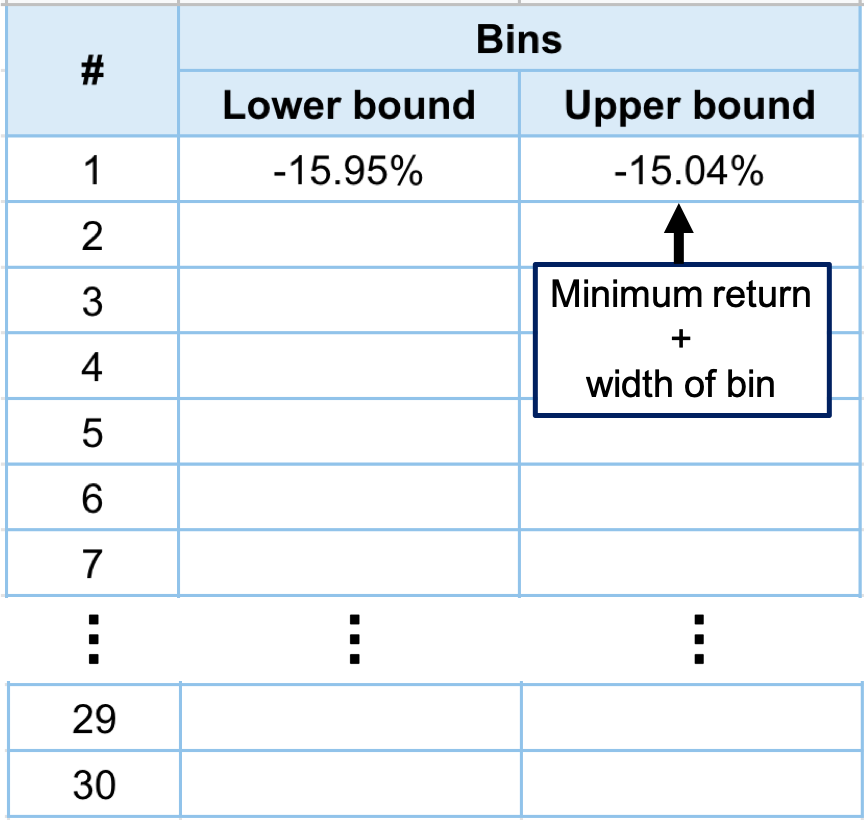
Histogram of historical returns: bins
1) Divide the range of returns into bins
Histogram of historical returns: bins
1) Divide the range of returns into bins
Histogram of historical returns: bins
1) Divide the range of returns into bins
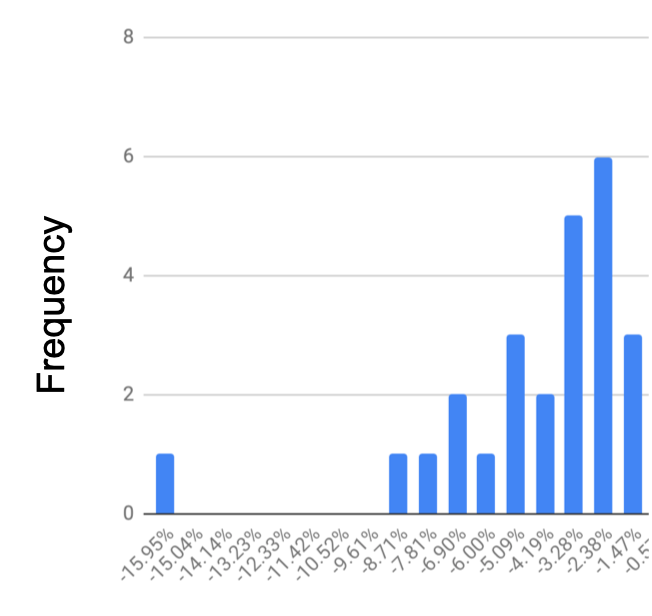
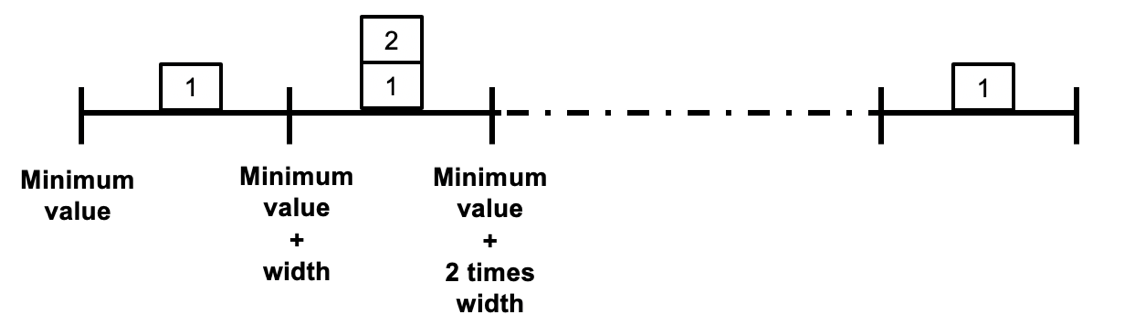
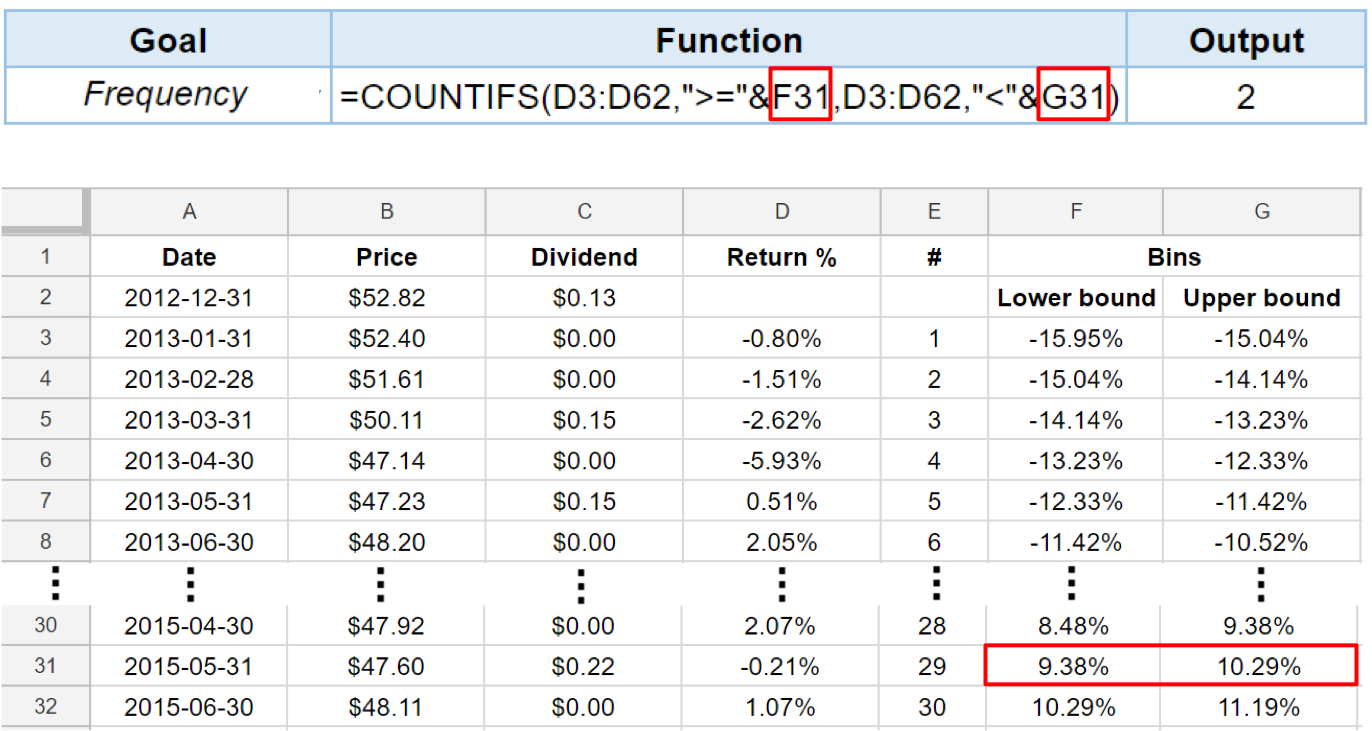
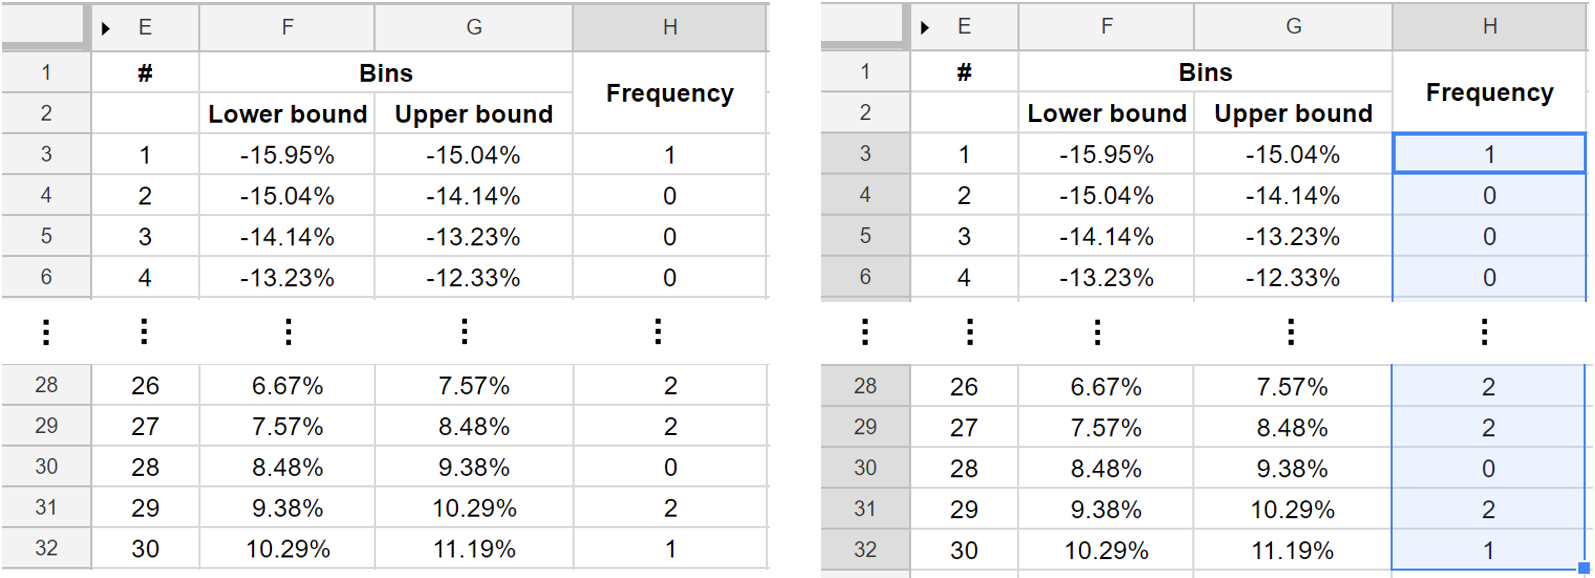
Histogram of historical returns: frequency
2) Compute the frequency of past returns for each bin
Histogram of historical returns: frequency
2) Compute the frequency of past returns for each bin
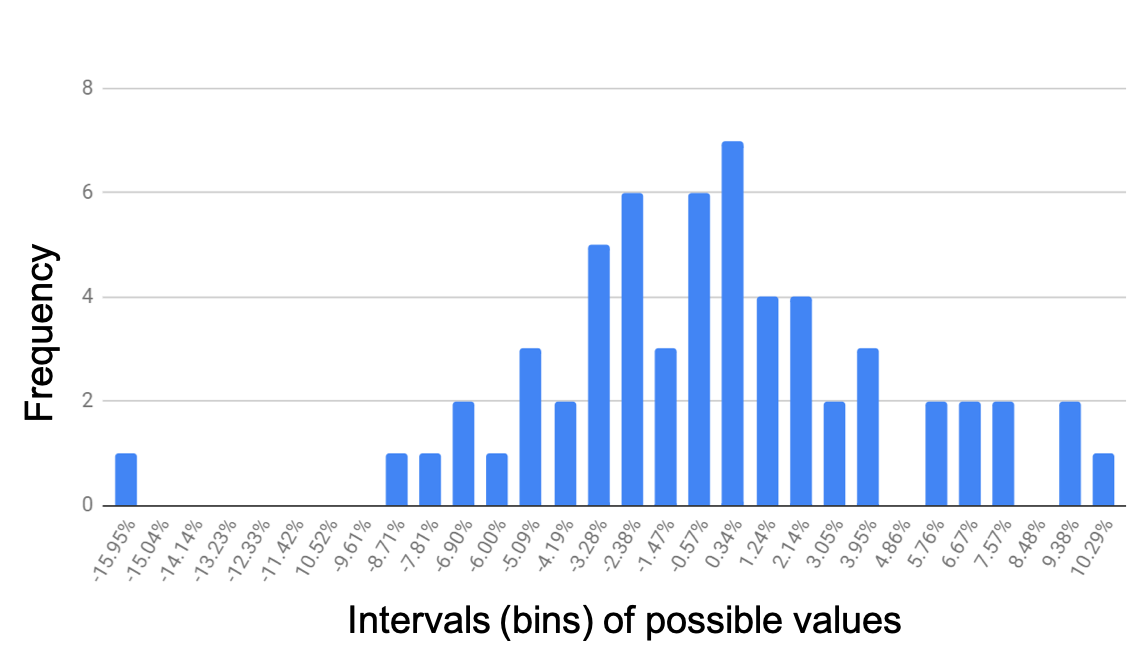
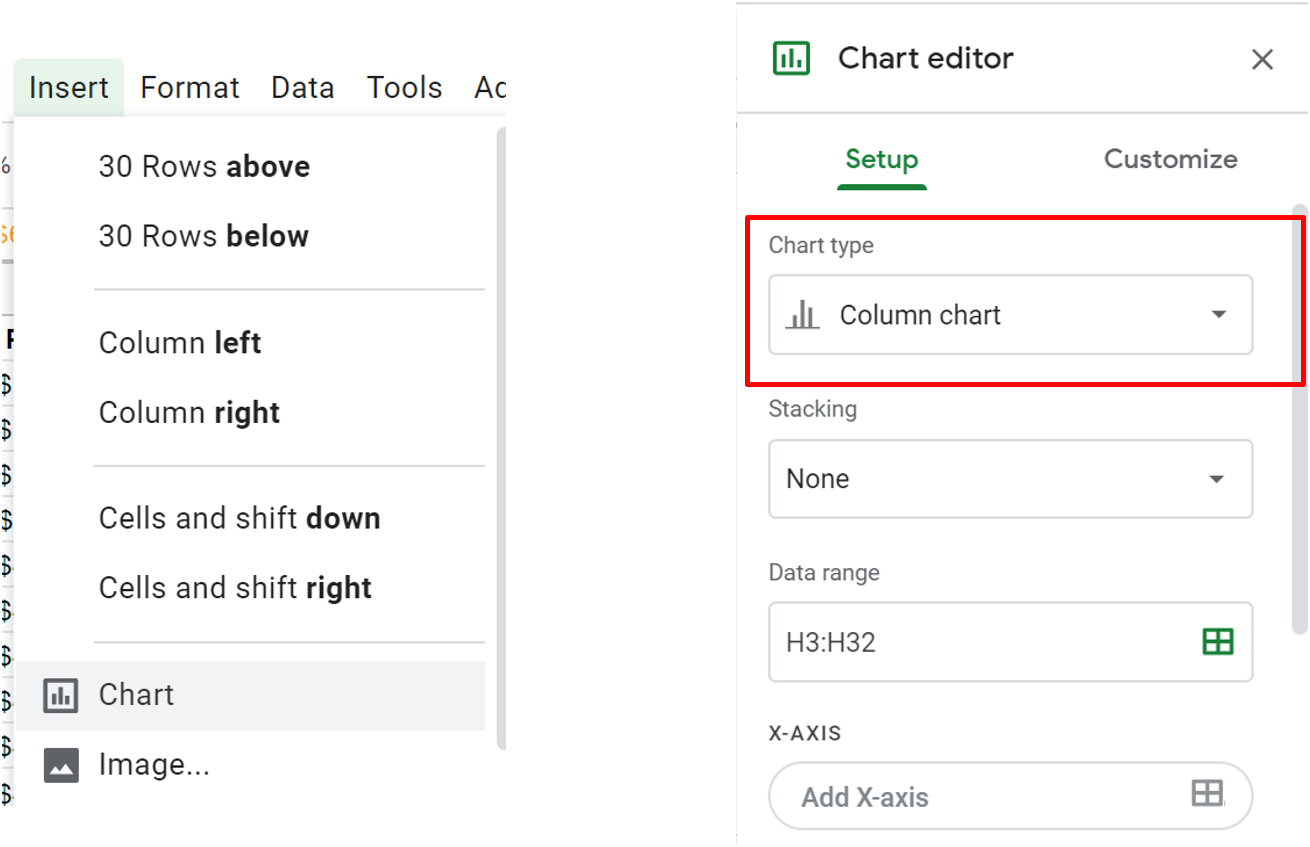
Histogram of historical returns: chart
3) Build the chart
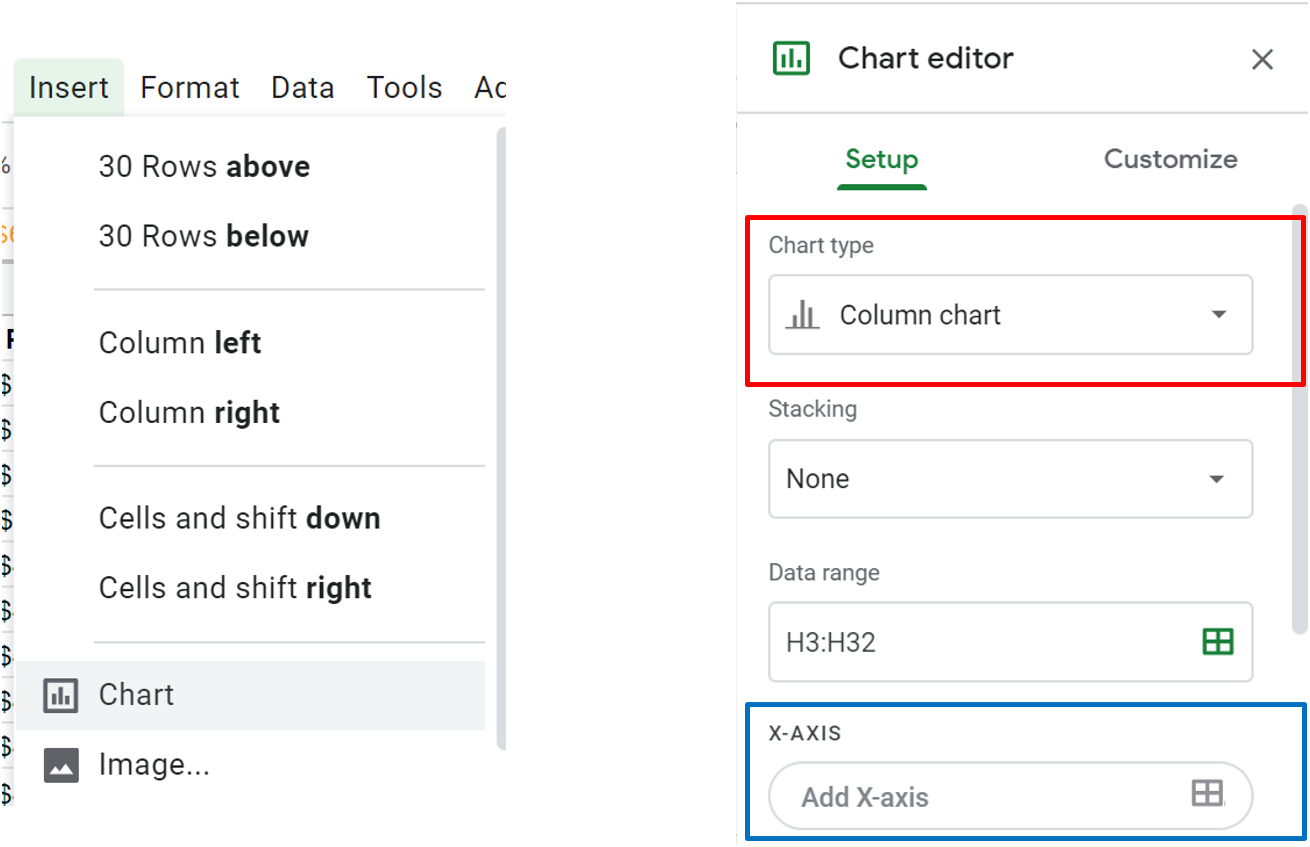
Histogram of historical returns: chart
3) Build the chart
Histogram of historical returns: chart
3) Build the chart
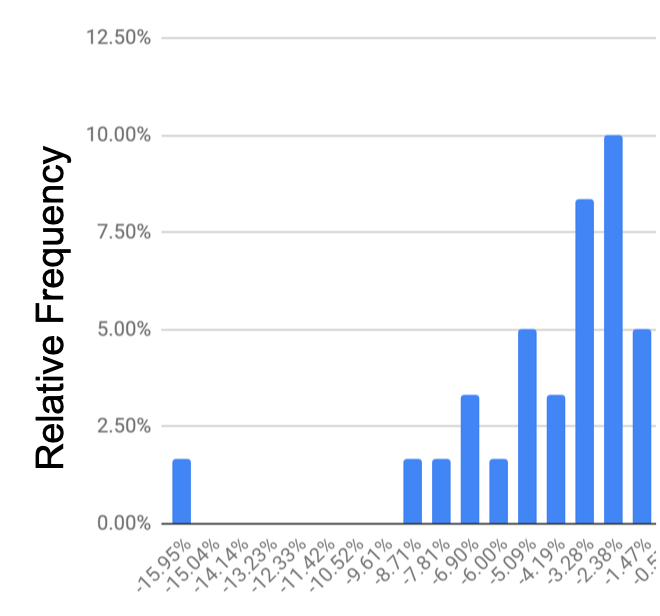
Relative frequency