Risk-adjusted metrics
Financial Analytics in Google Sheets

David Ardia
Professor in Quantitative Methods for Finance
Sharpe ratio with Google Sheets
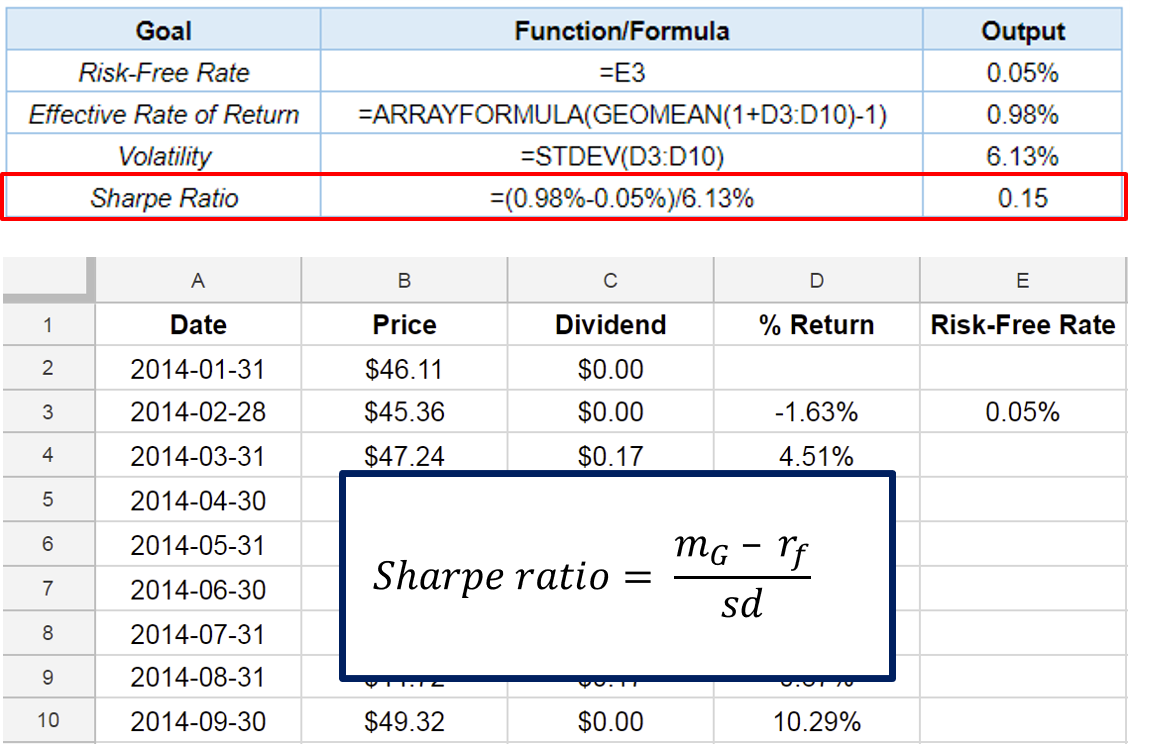
Volatility and Sharpe ratio
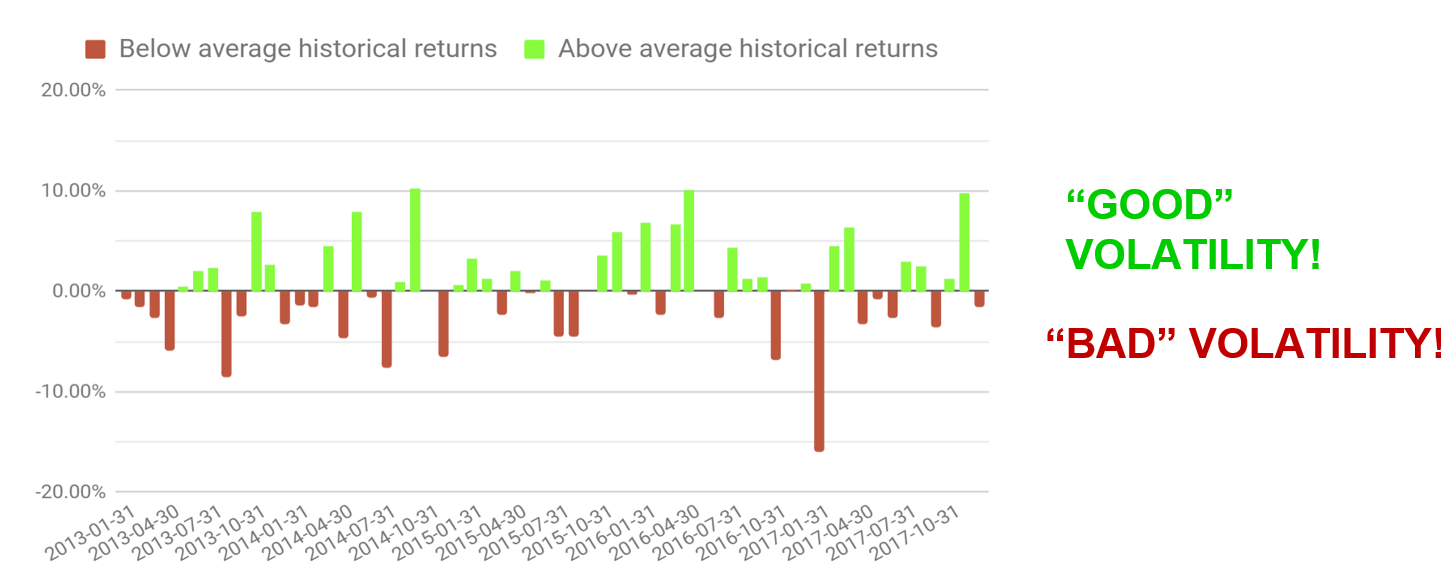
- High volatility penalizes the Sharpe ratio
- Is volatility bad for investors?
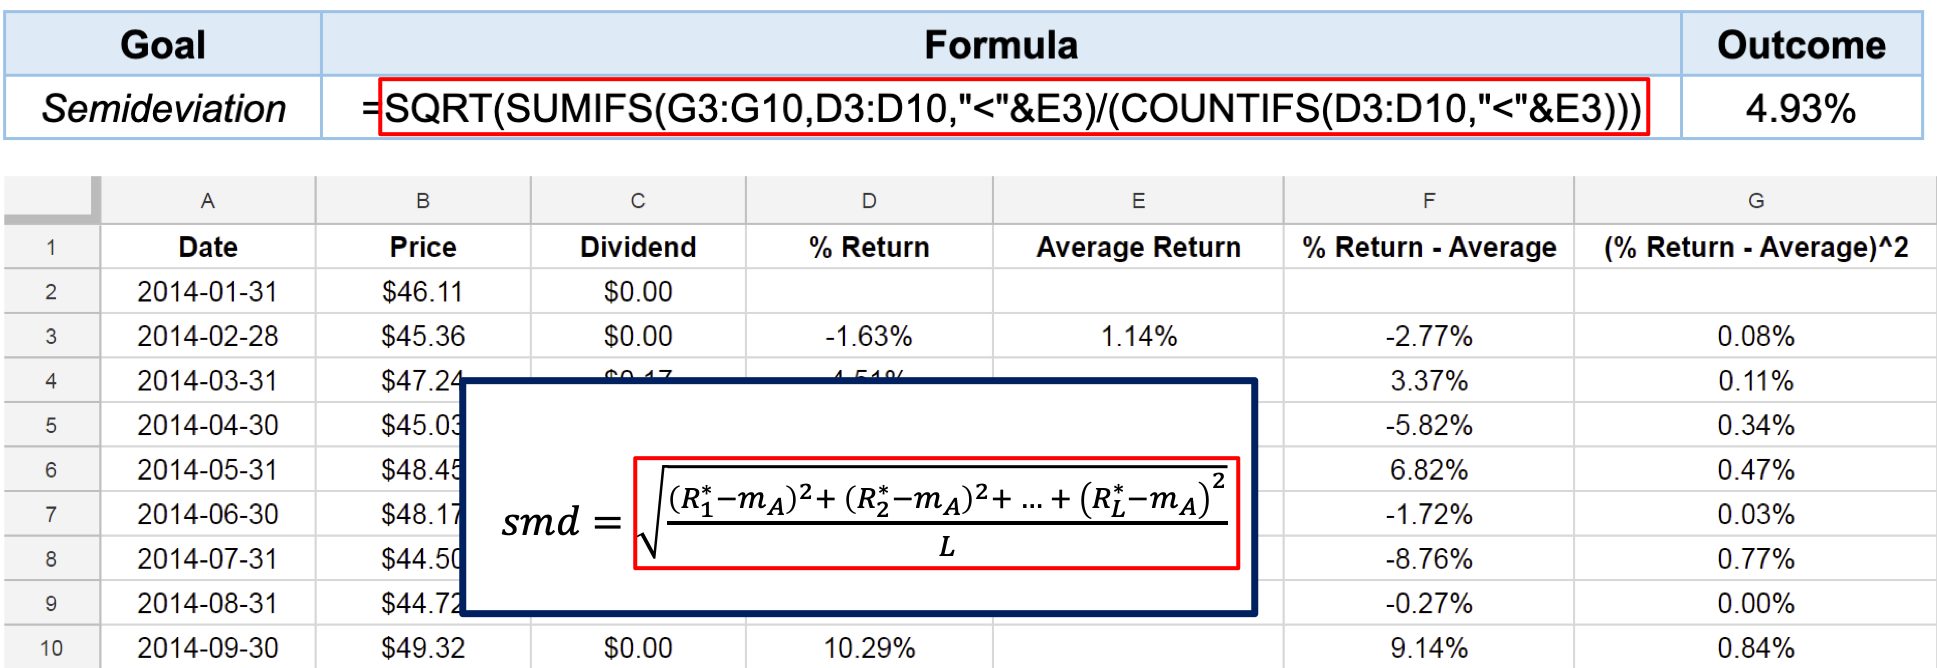
Semideviation with Google Sheets
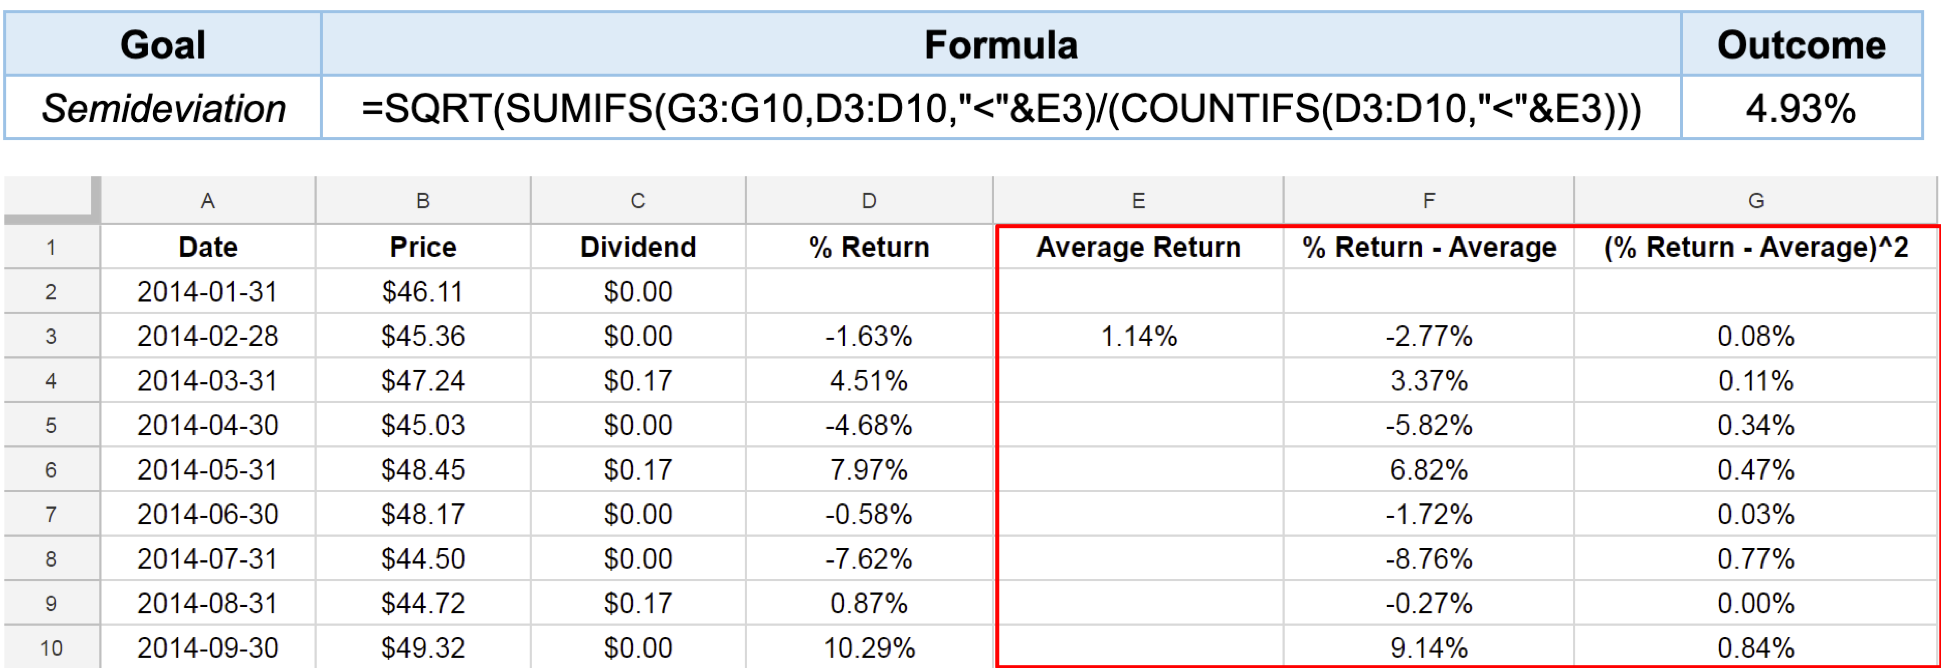
Semideviation with Google Sheets
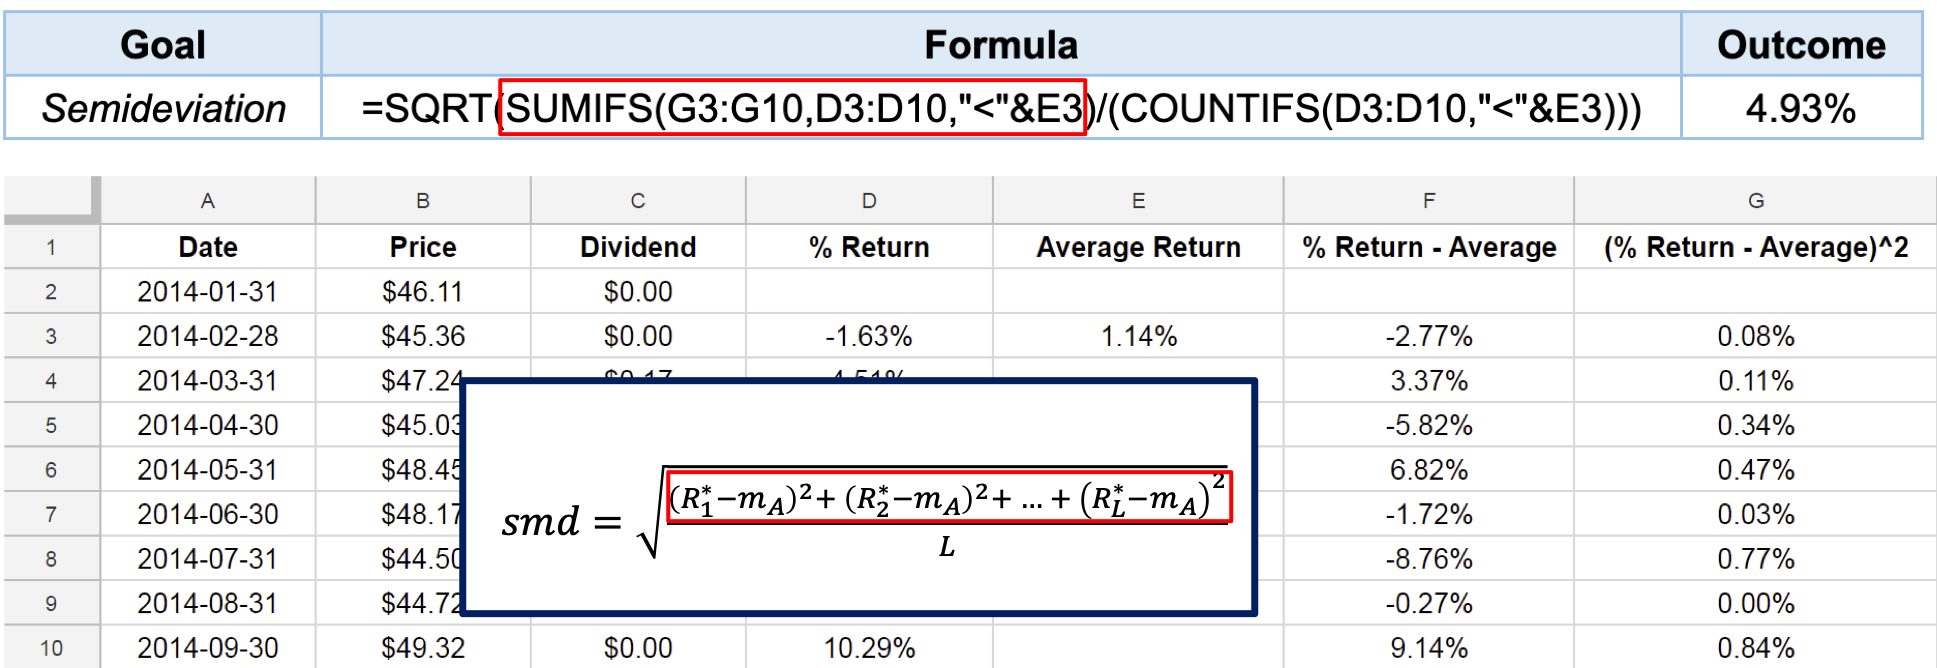
Semideviation with Google Sheets
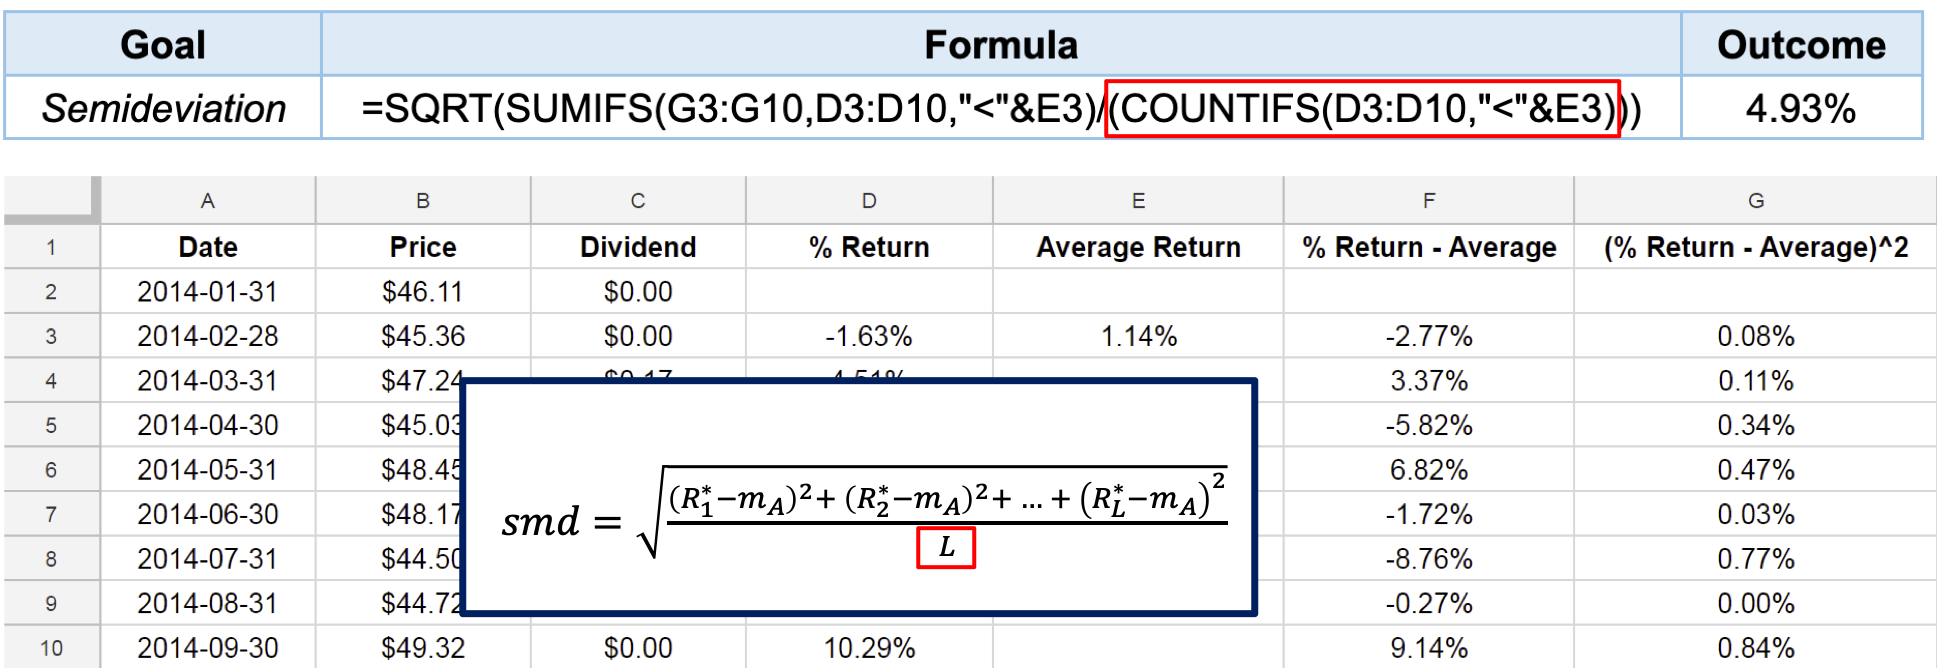
Semideviation with Google Sheets
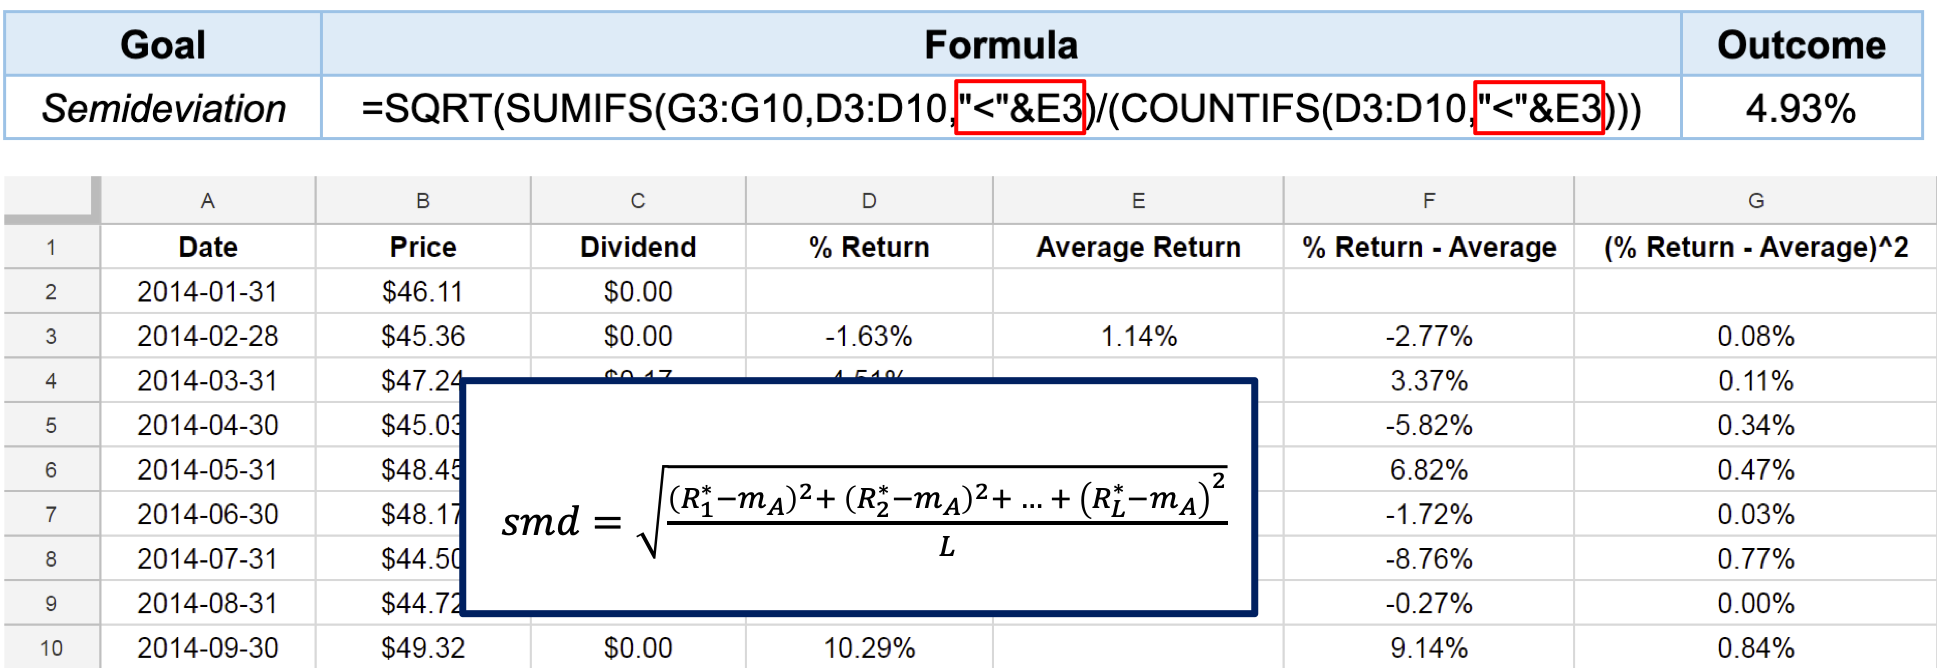
Semideviation with Google Sheets