Limitations of the Gaussian model
Financial Analytics in Google Sheets

David Ardia
Professor of Quantitative Methods for Finance
Deviations from the Gaussian model
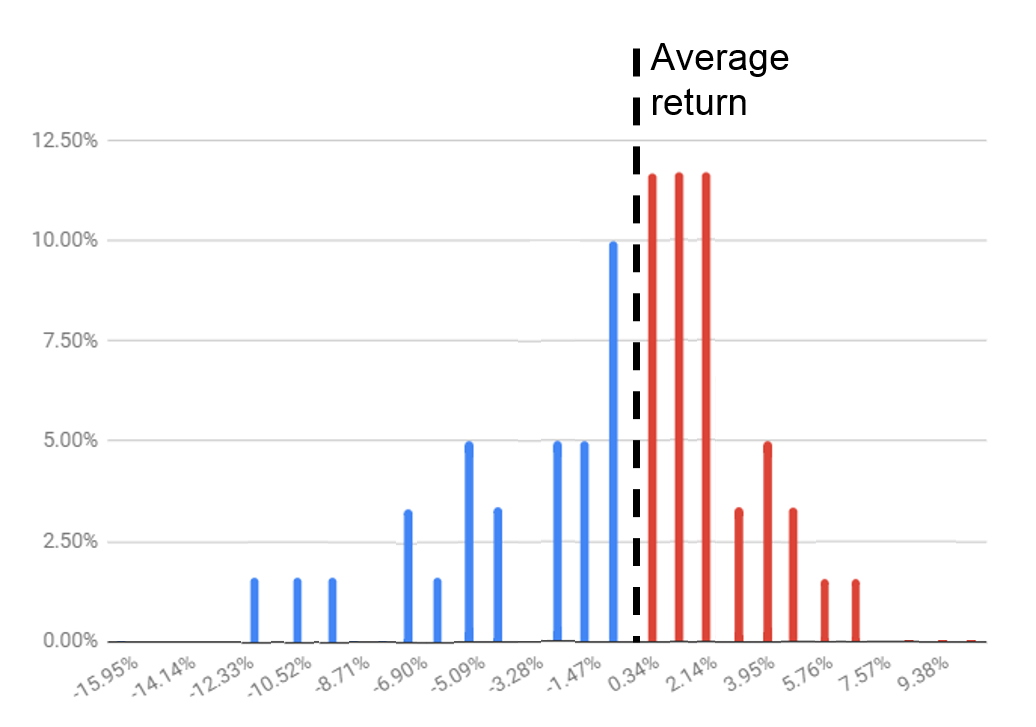
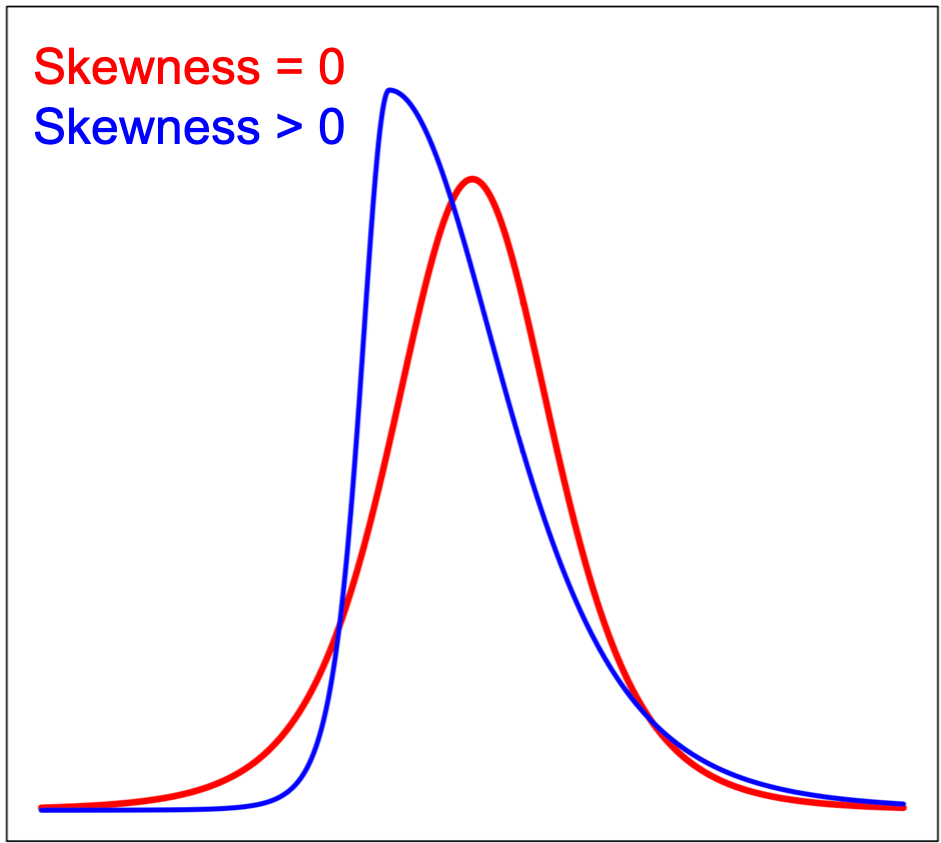
Returns are not symmetrically distributed
Deviations from the Gaussian model
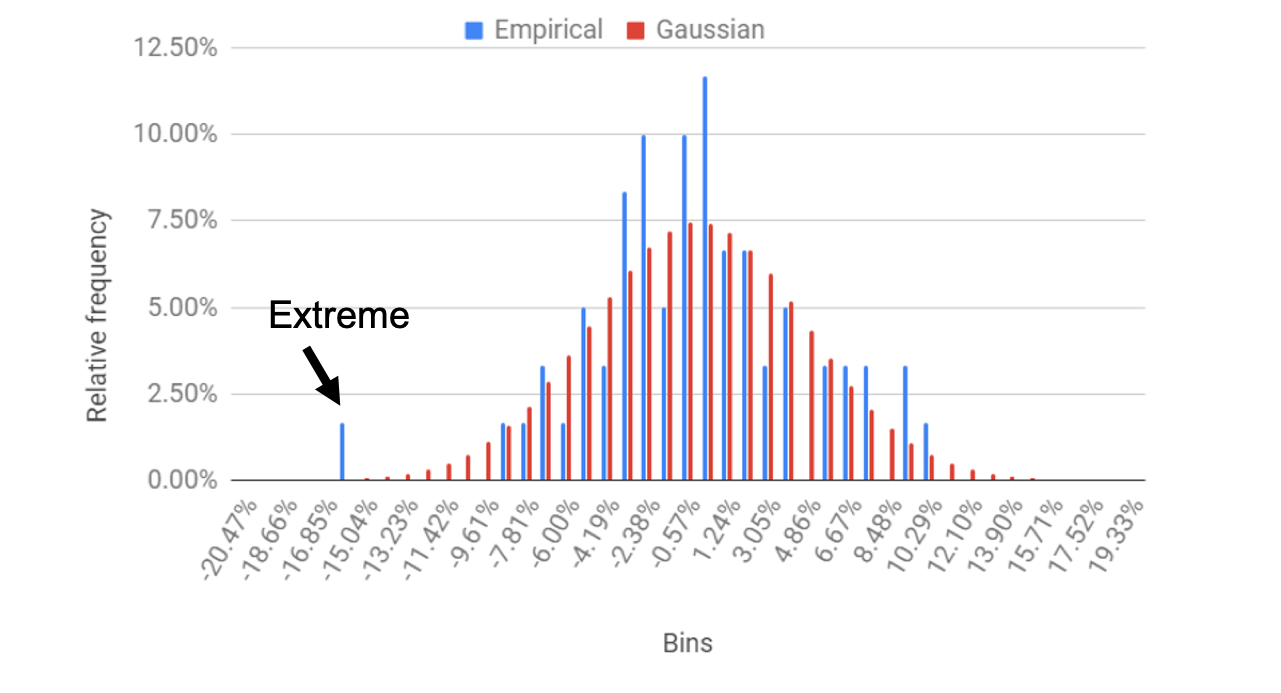
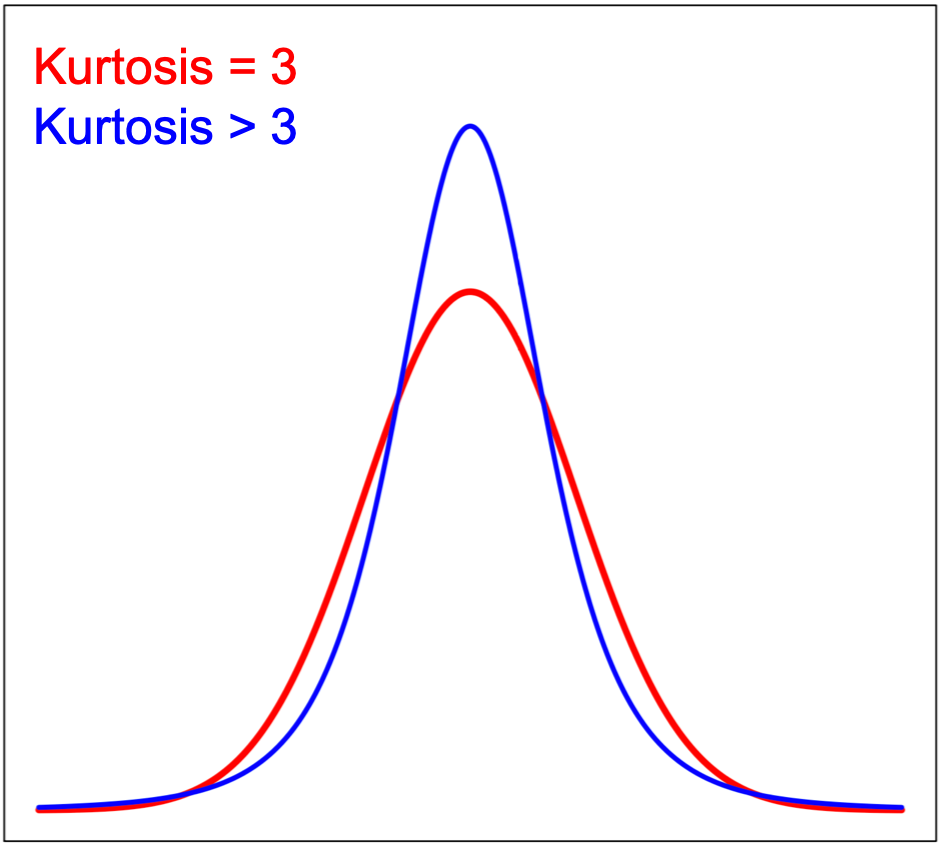
Very large returns are not captured by the Gaussian model
Skewness coefficient
Left-skewed
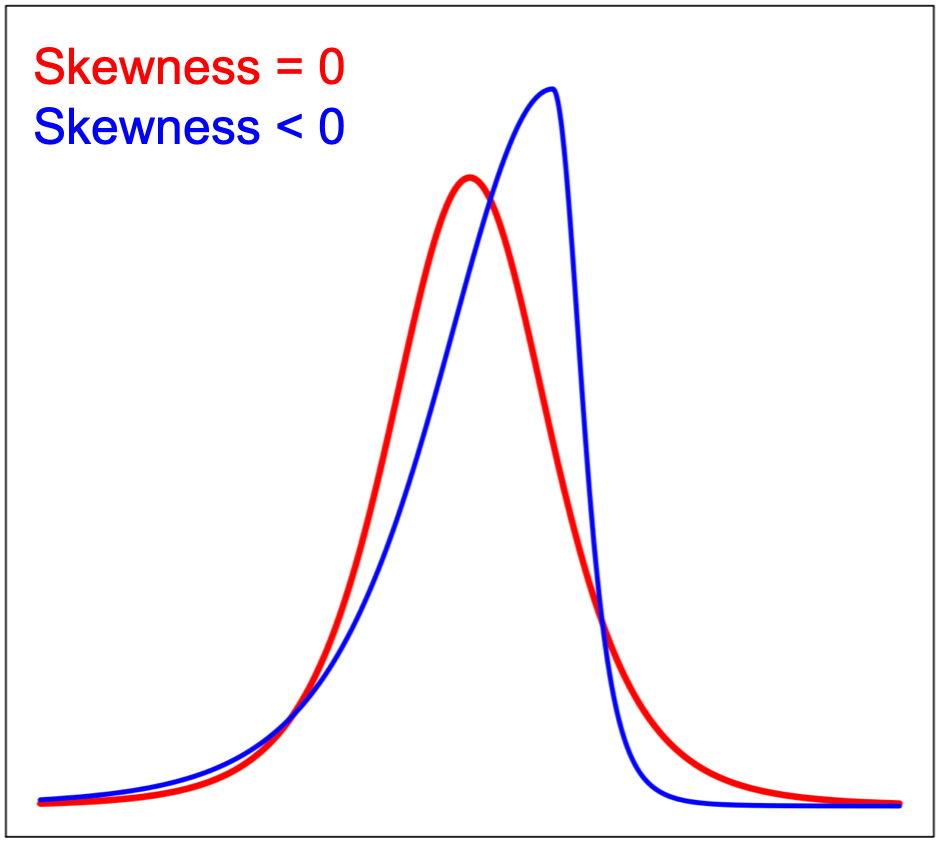
Right-skewed
Kurtosis coefficient
Excess kurtosis = kurtosis - 3
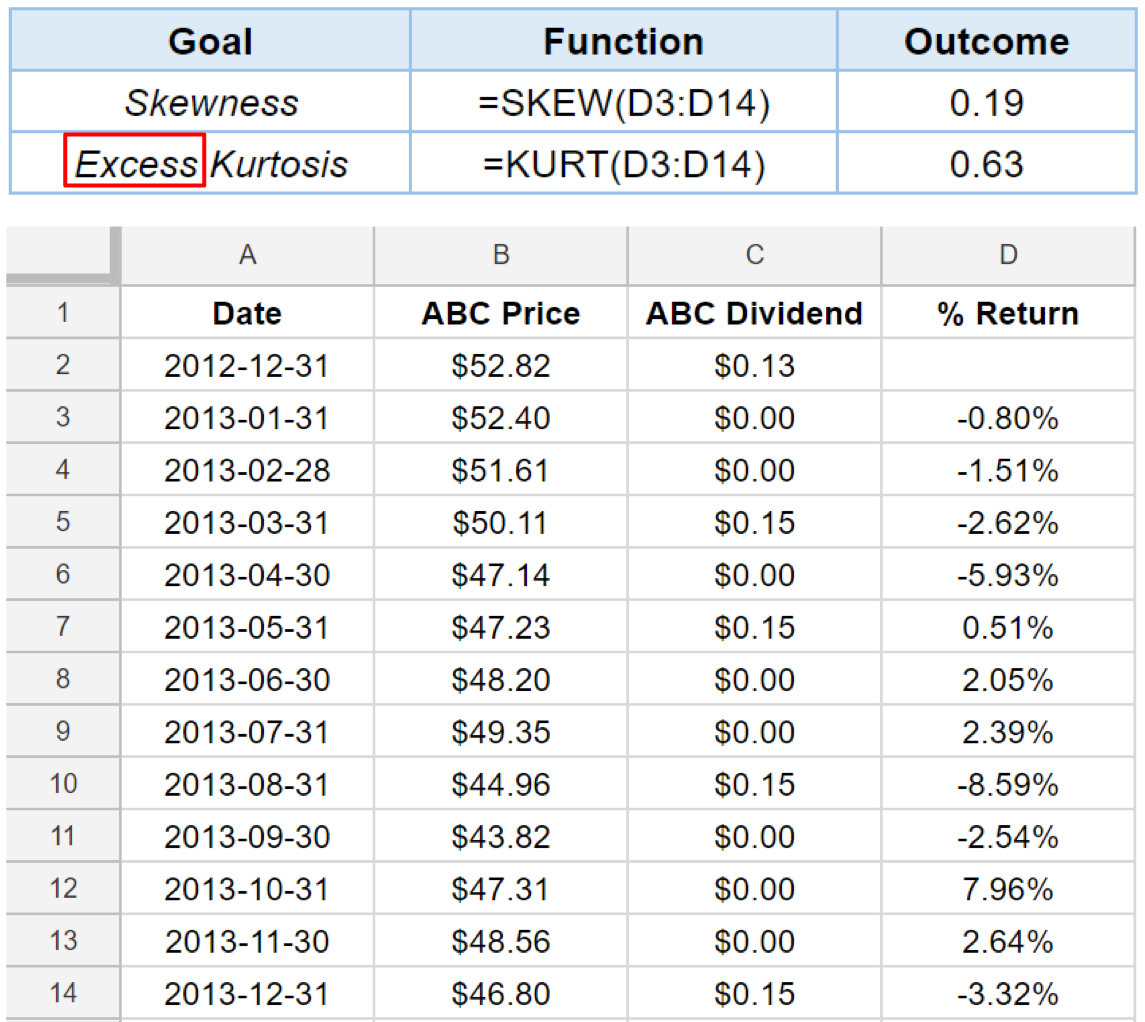
Skewness and kurtosis with Google Sheets
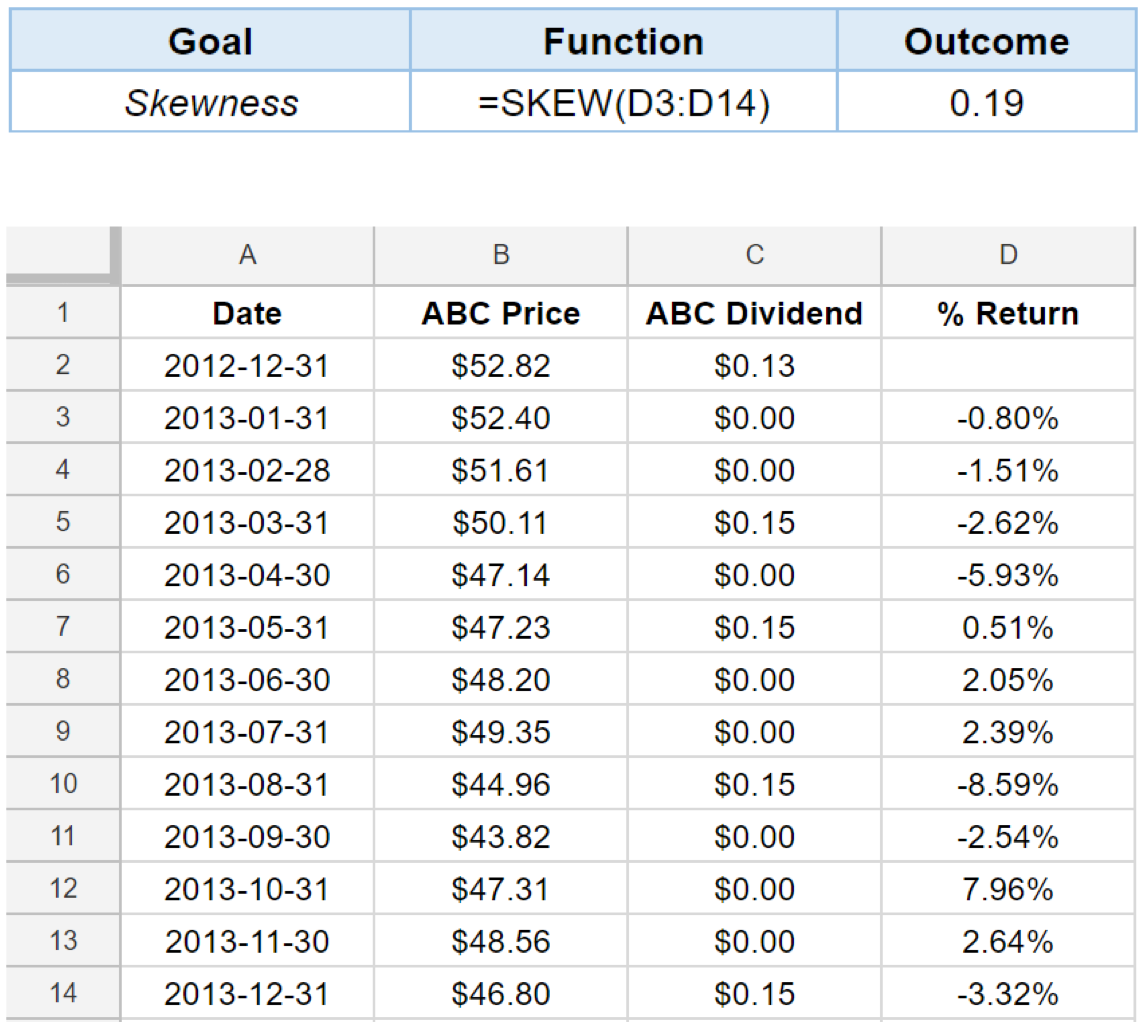
Skewness and kurtosis with Google Sheets