Reward metrics
Financial Analytics in Google Sheets

David Ardia
Professor in Quantitative Methods for Finance
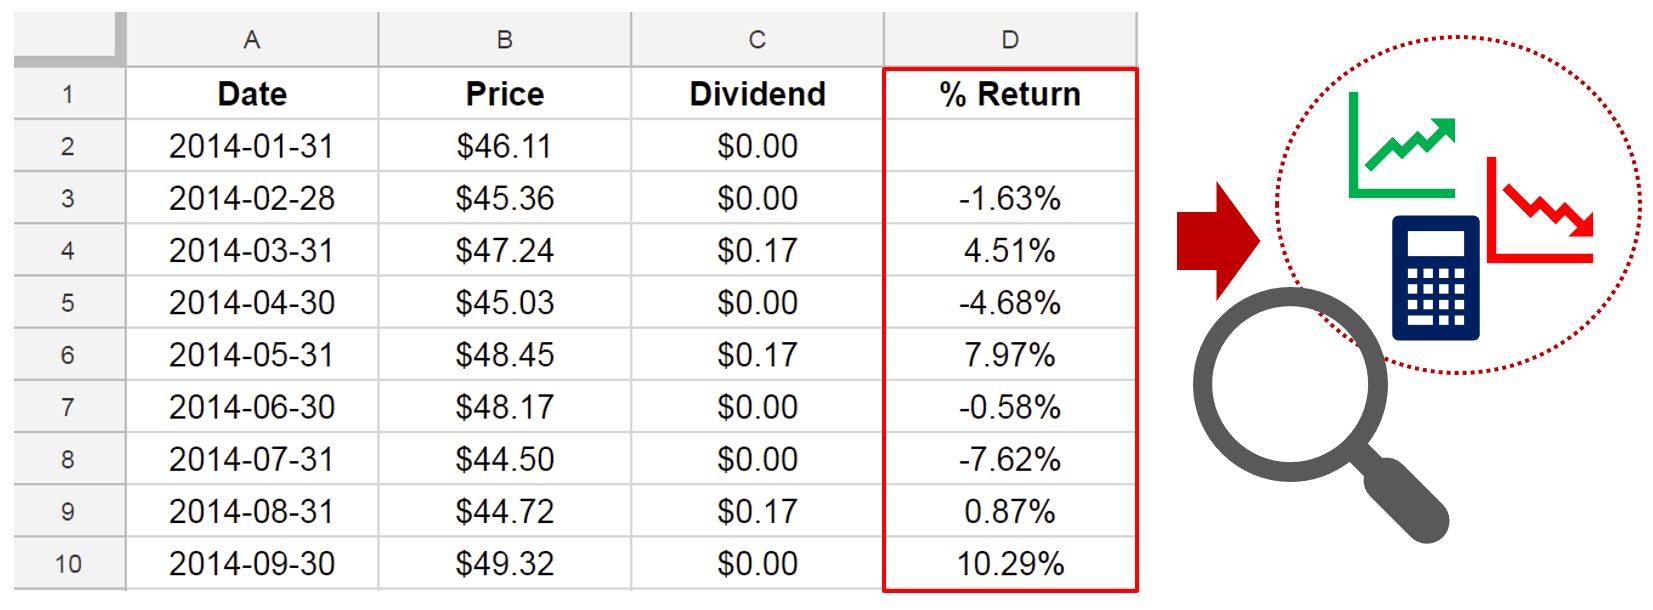
Return on investment
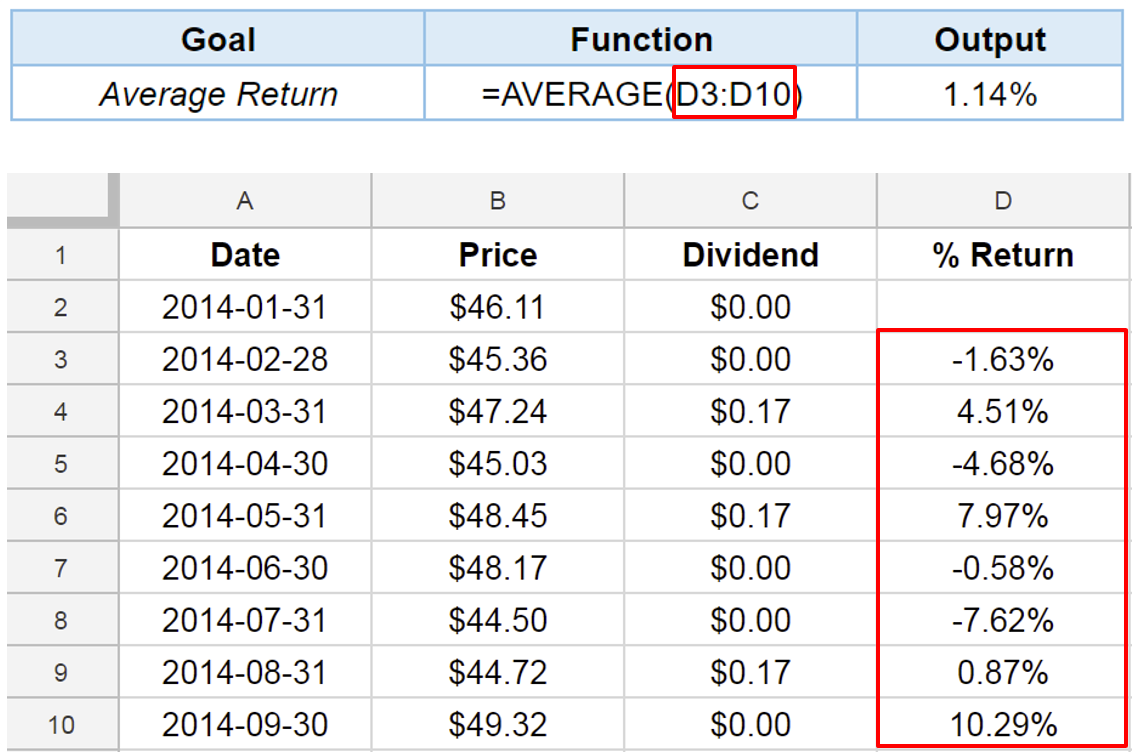
Average return

Function AVERAGE()
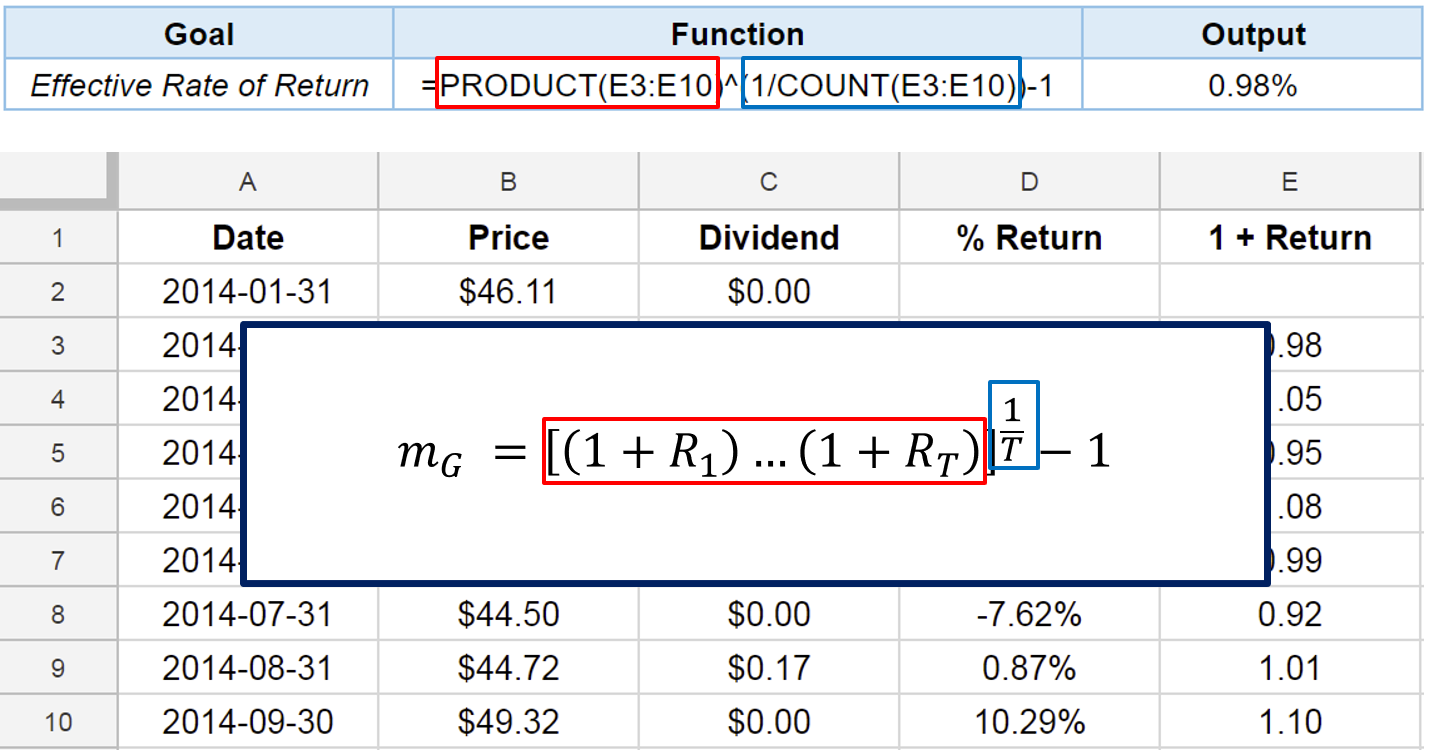
Effective rate of return: first approach
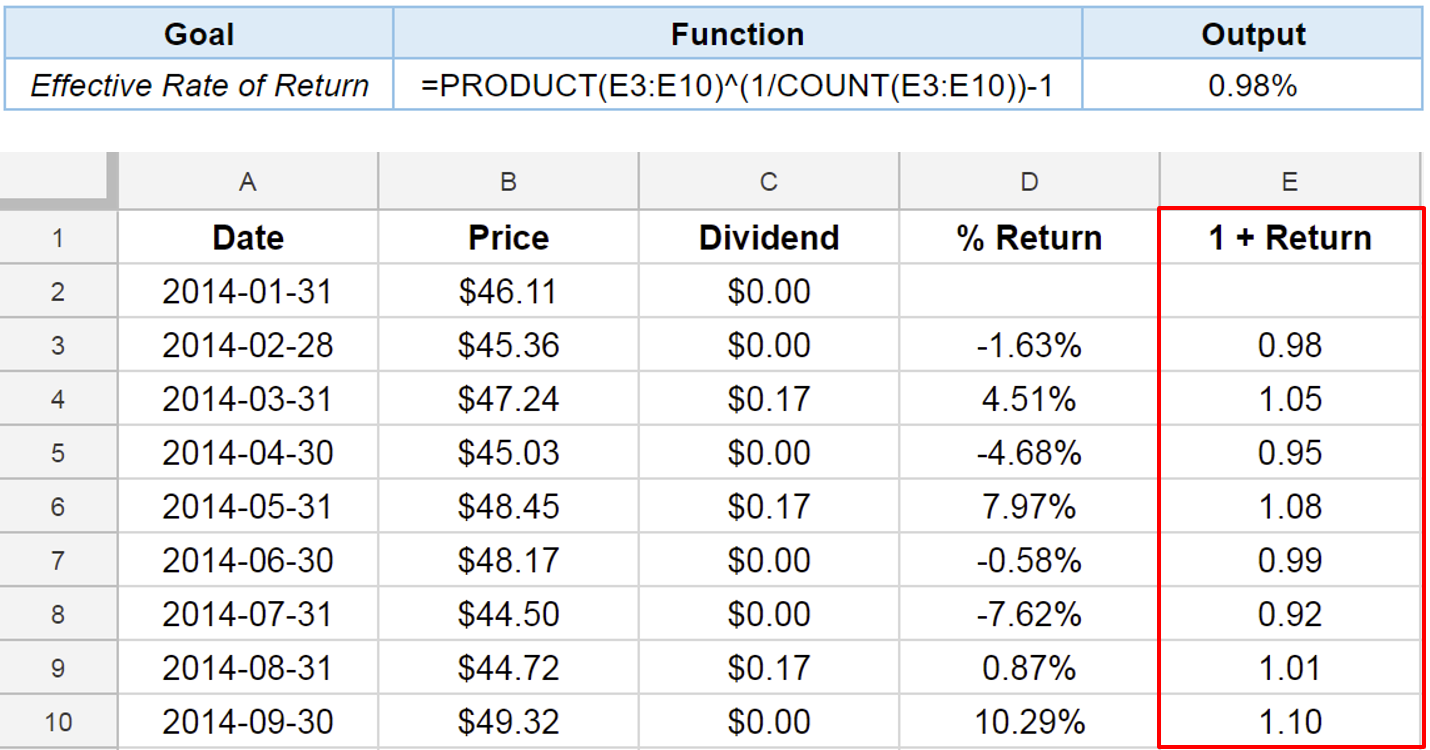
Effective rate of return: first approach
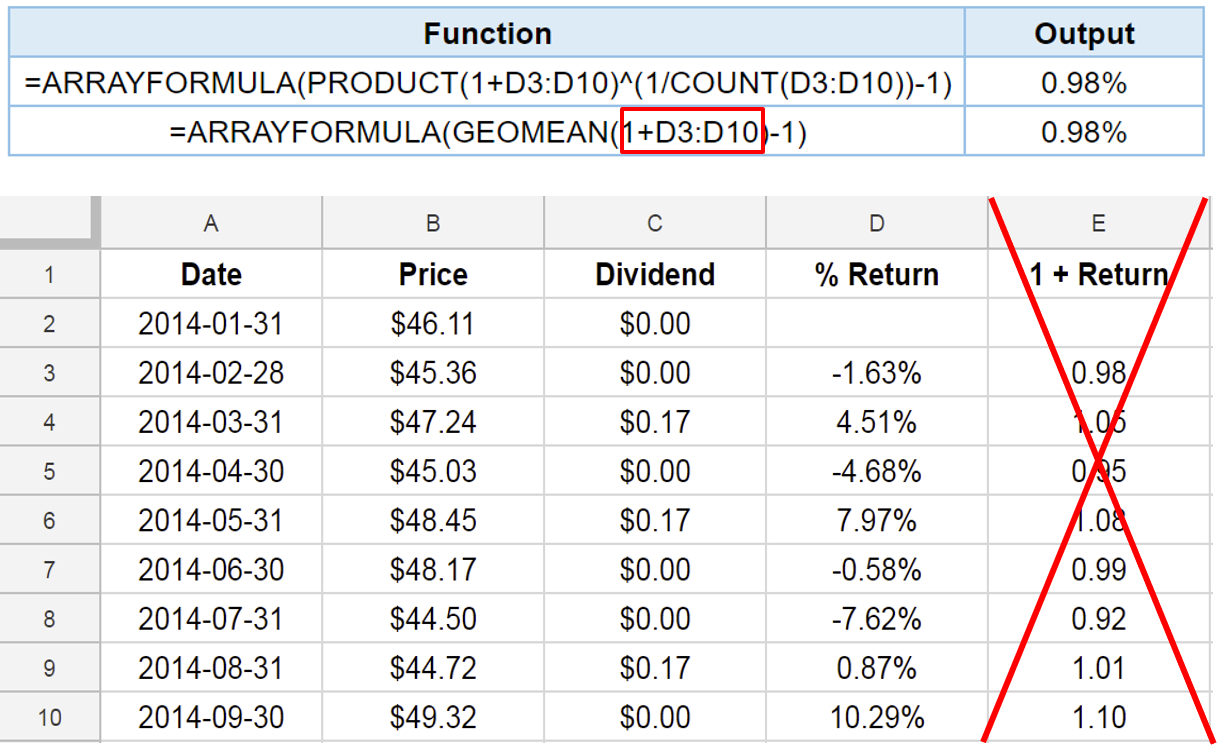
Function ARRAYFORMULA()
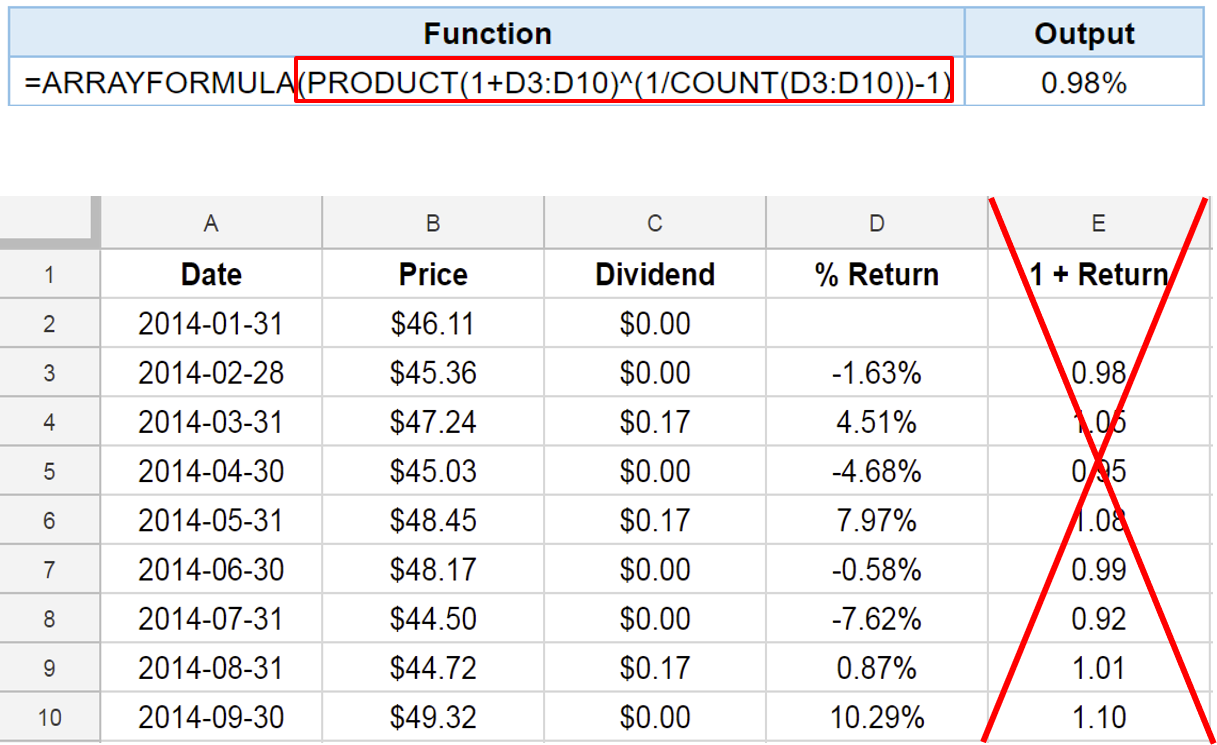
Functions ARRAYFORMULA() and GEOMEAN()