Risk metrics
Financial Analytics in Google Sheets

David Ardia
Professor in Quantitative Methods for Finance
Volatility
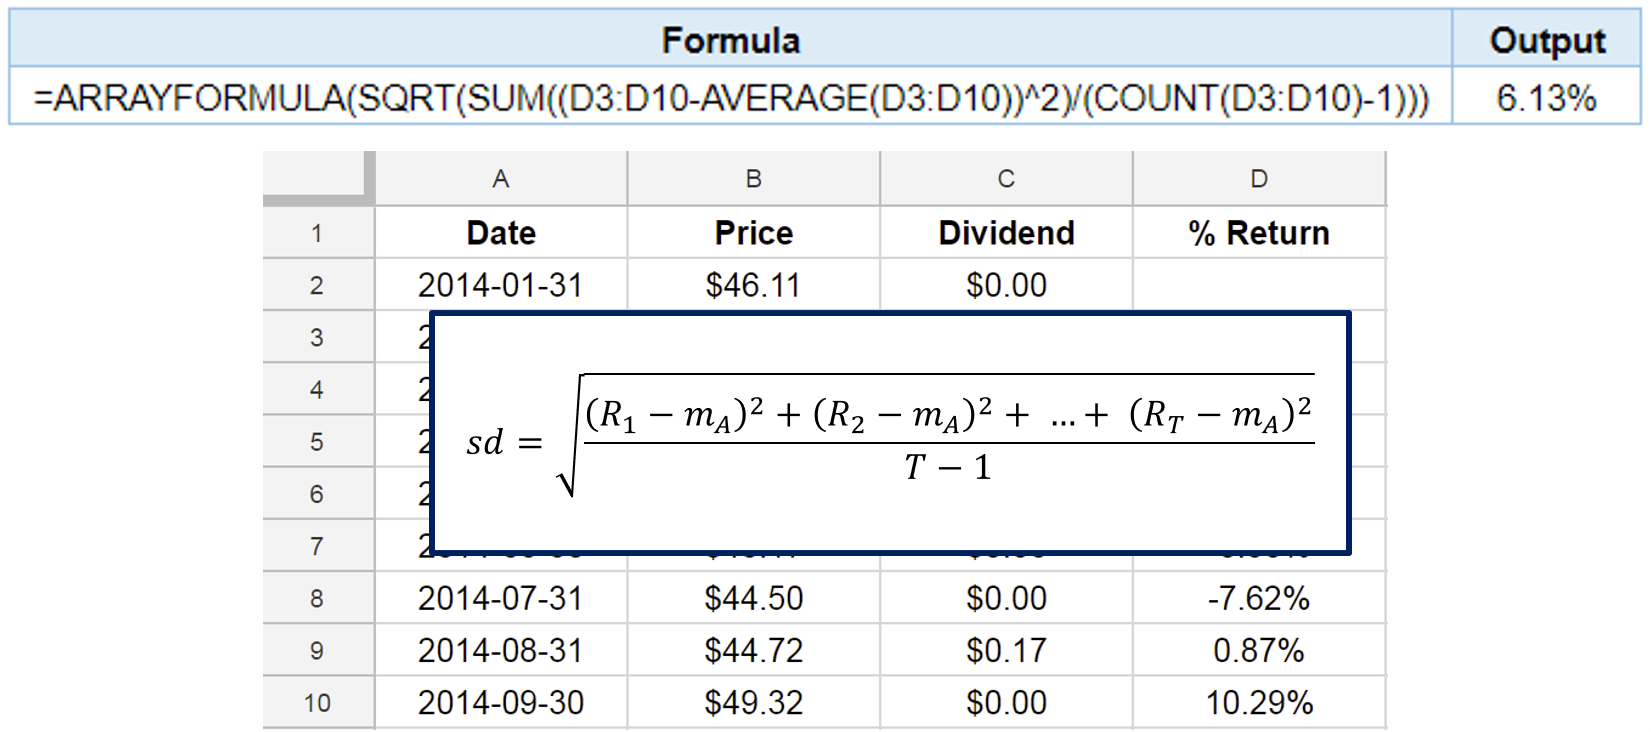
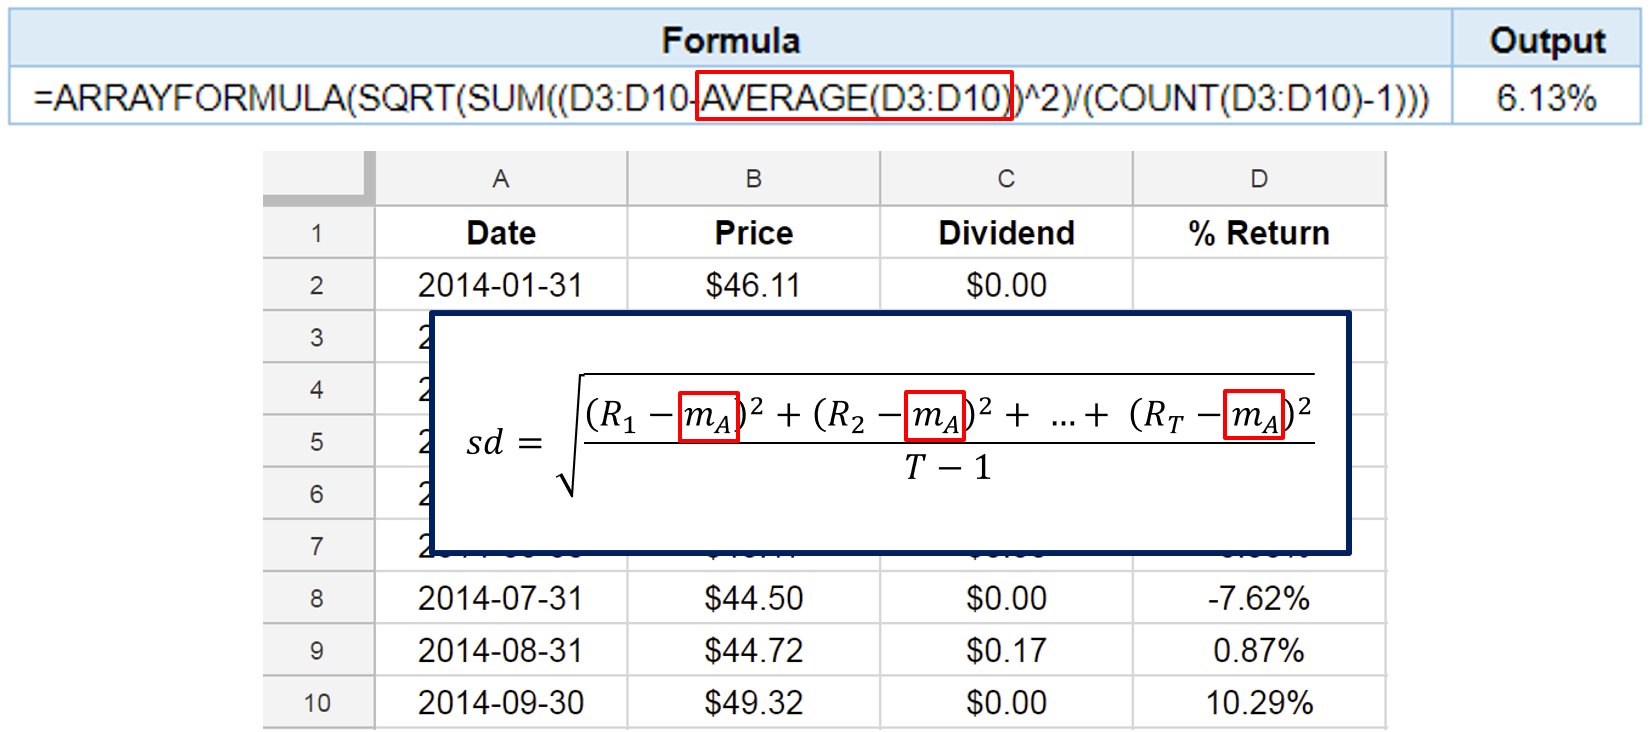
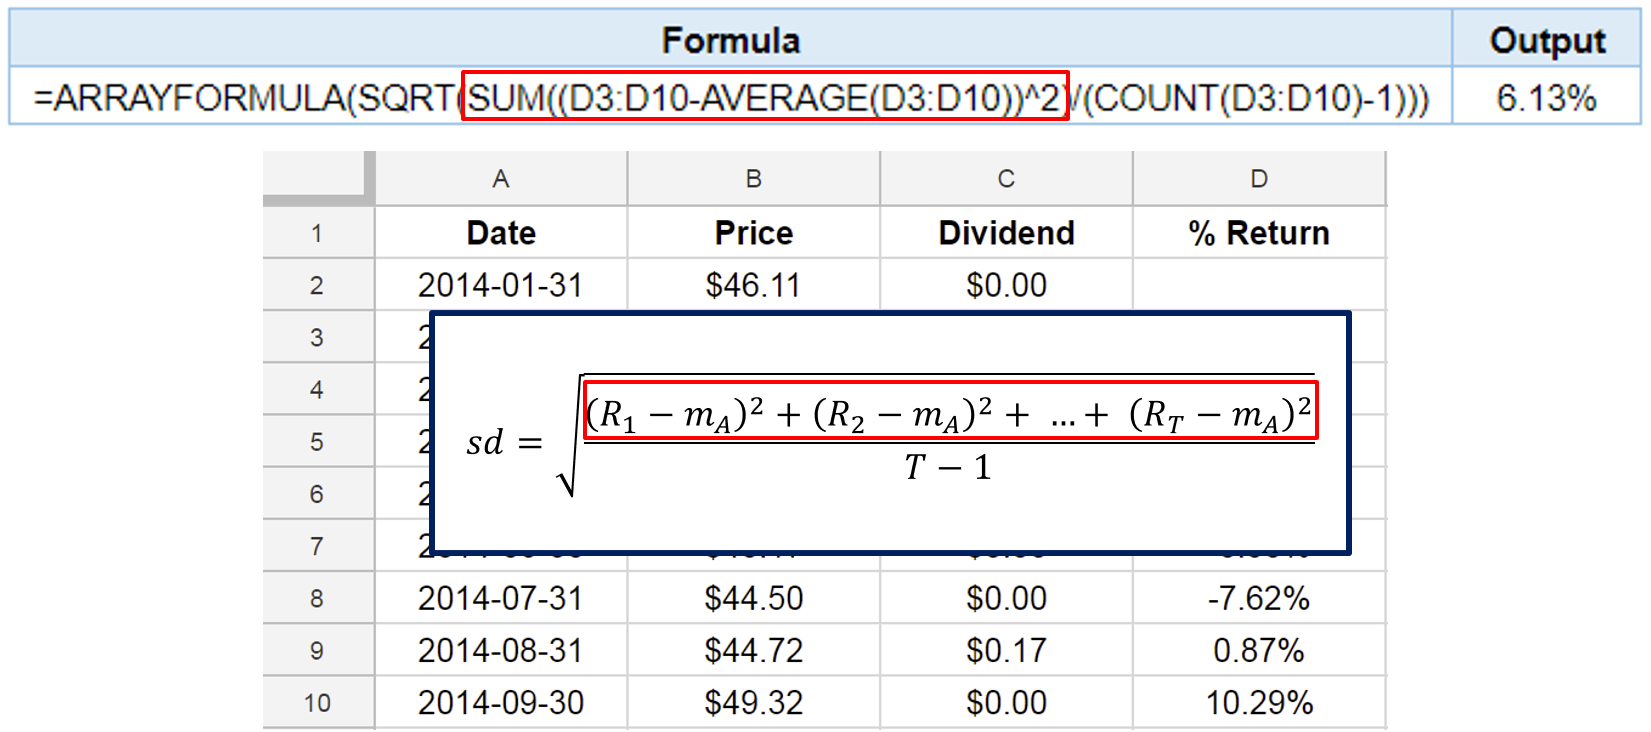
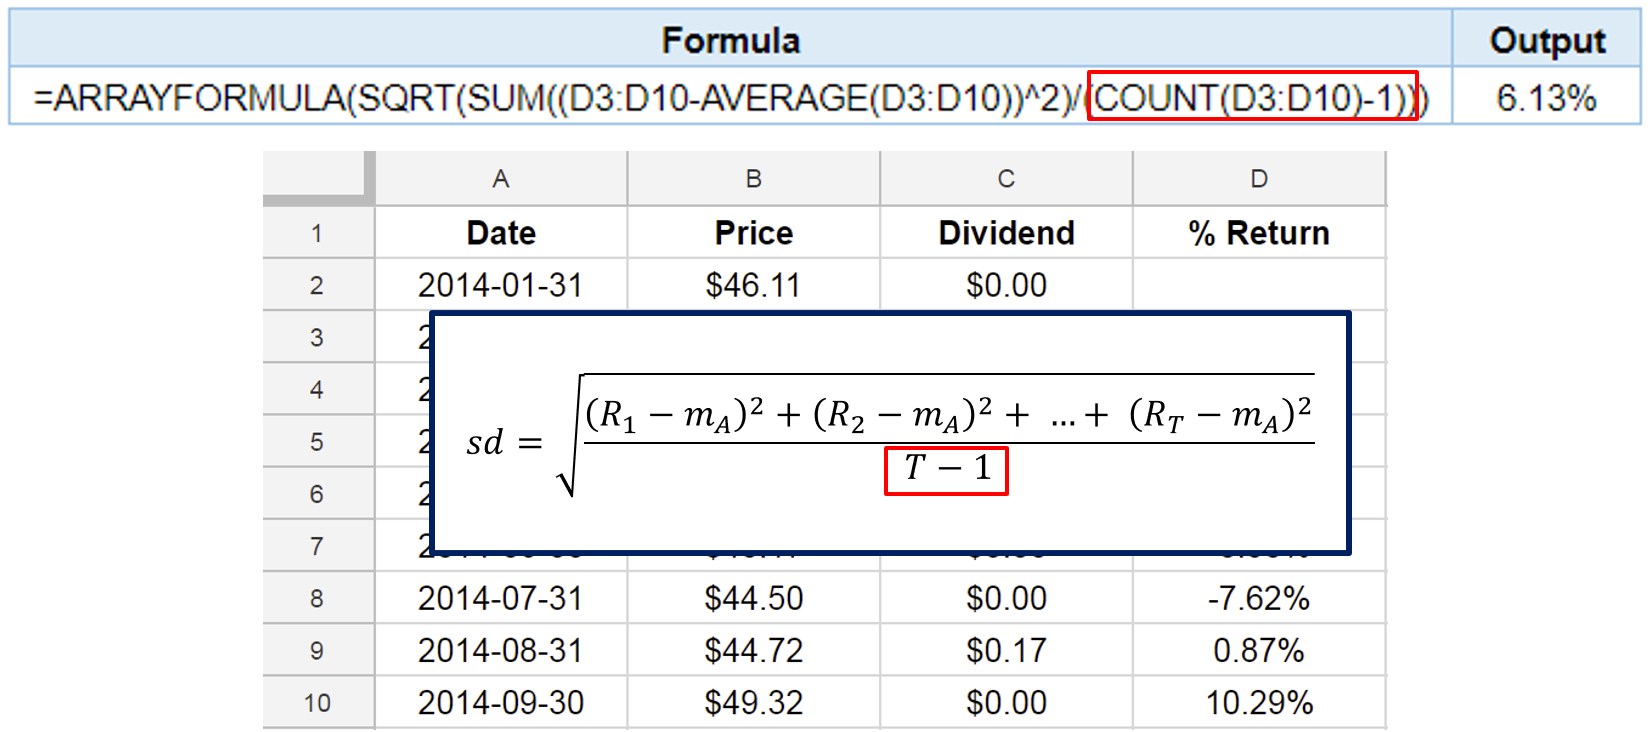
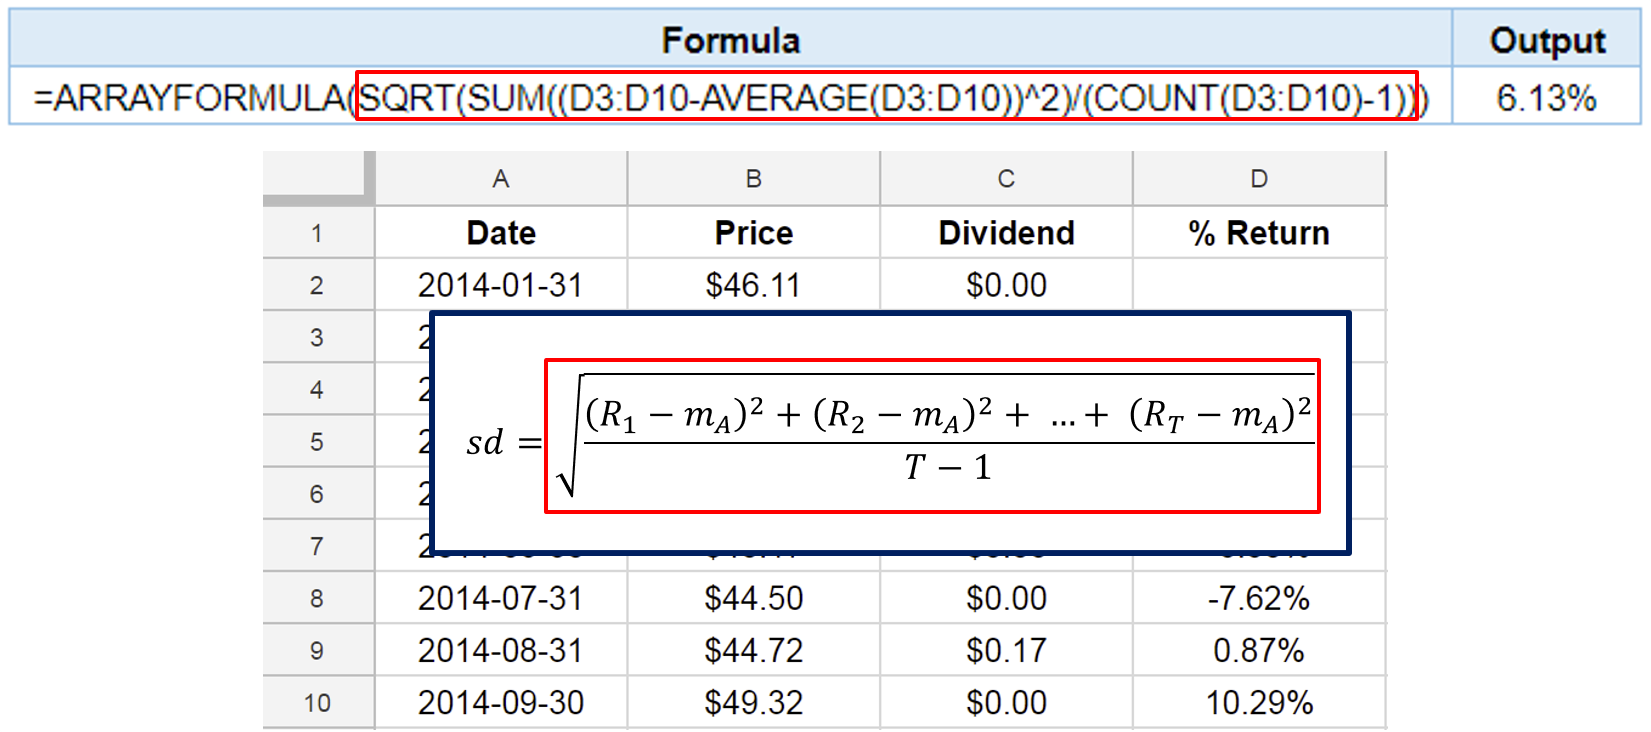
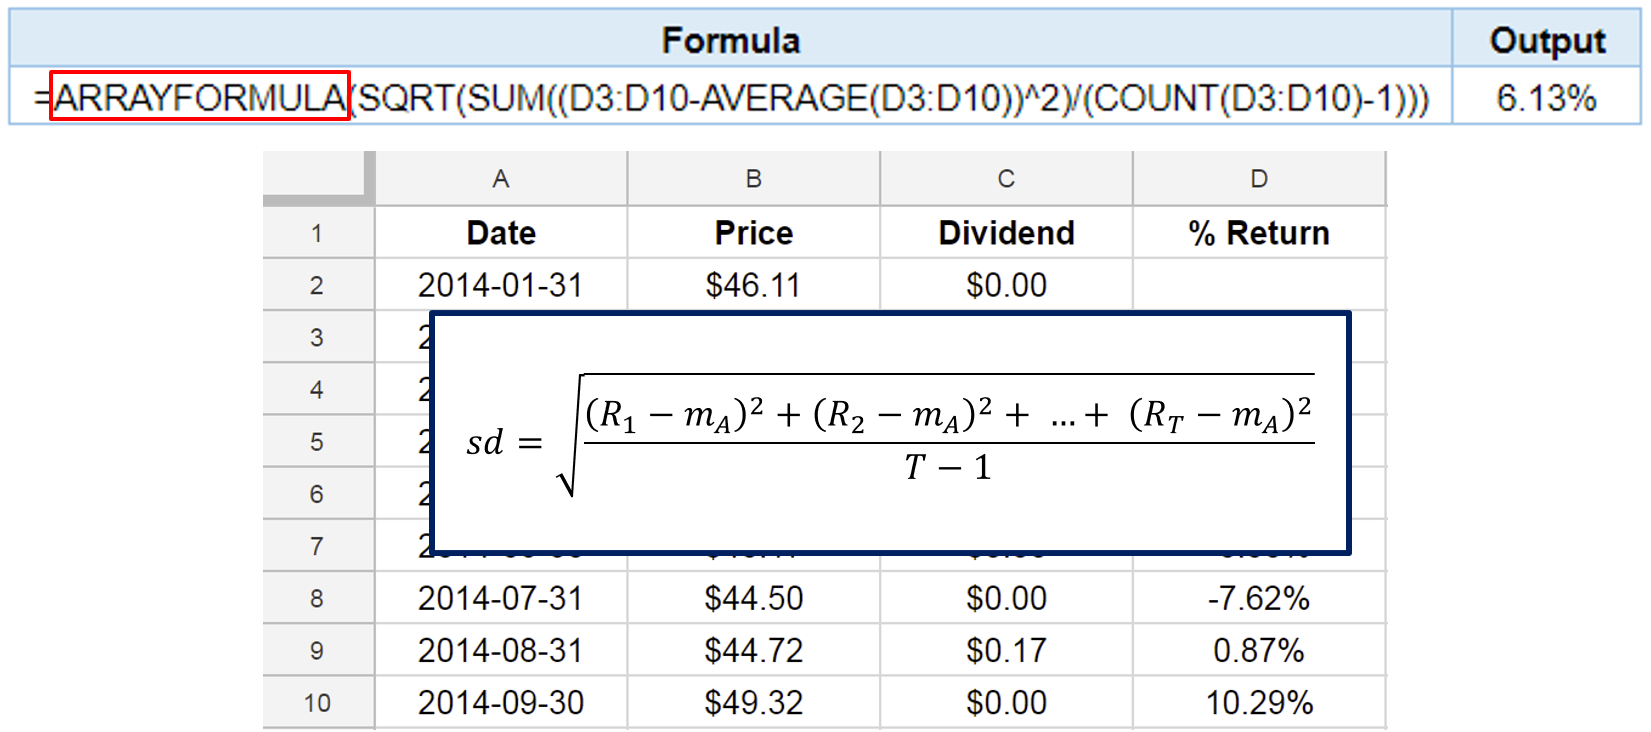
Volatility with Google Sheets
Volatility with Google Sheets
Volatility with Google Sheets
Volatility with Google Sheets
Volatility with Google Sheets
Volatility with Google Sheets
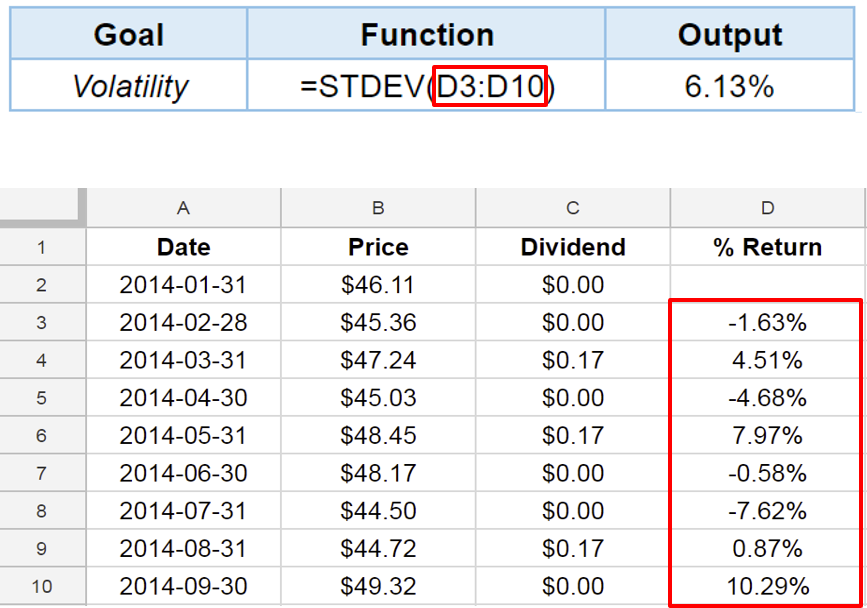
Function STDEV()
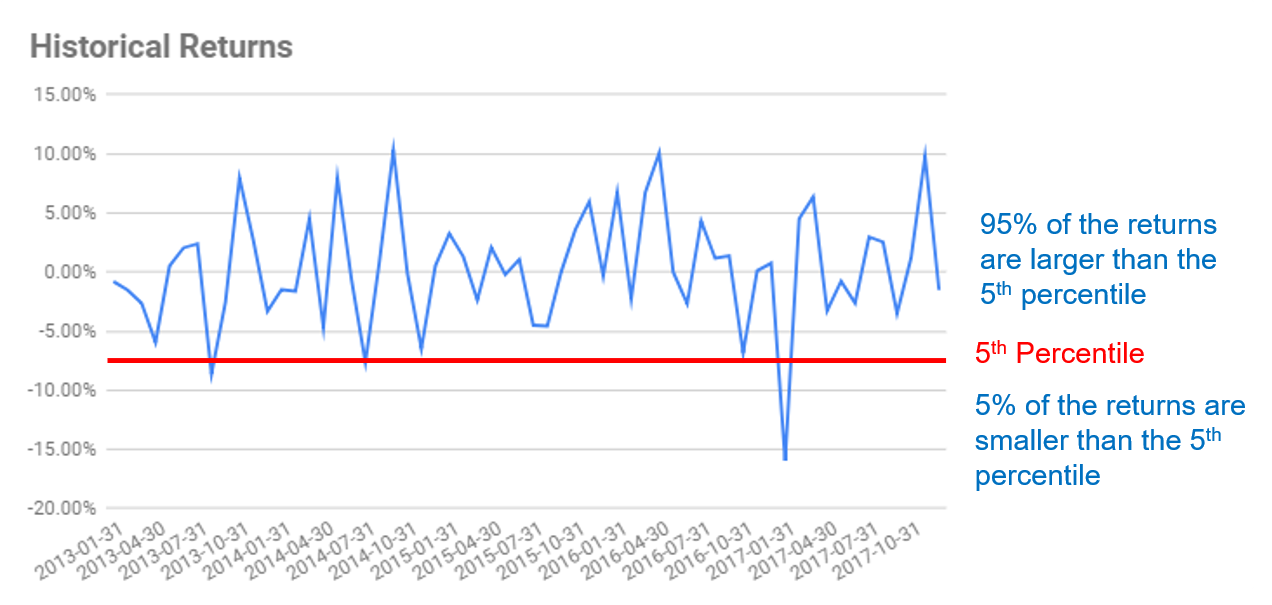
Intuition behind the value-at-risk
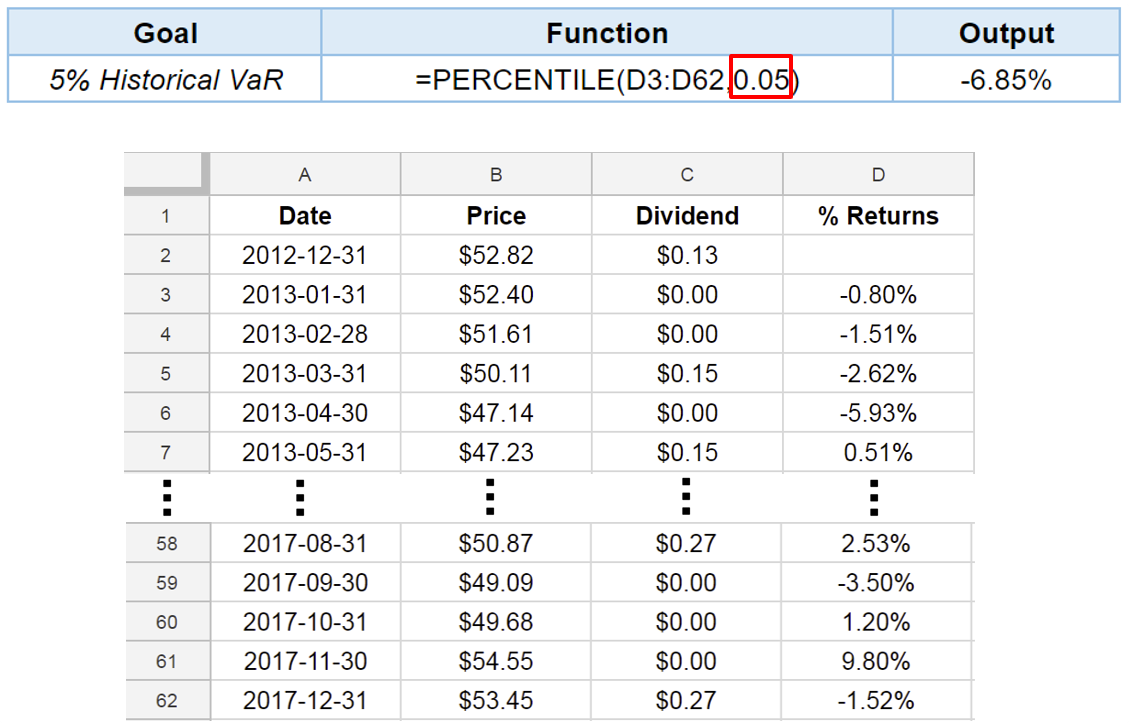
5% Historical VaR with function PERCENTILE()
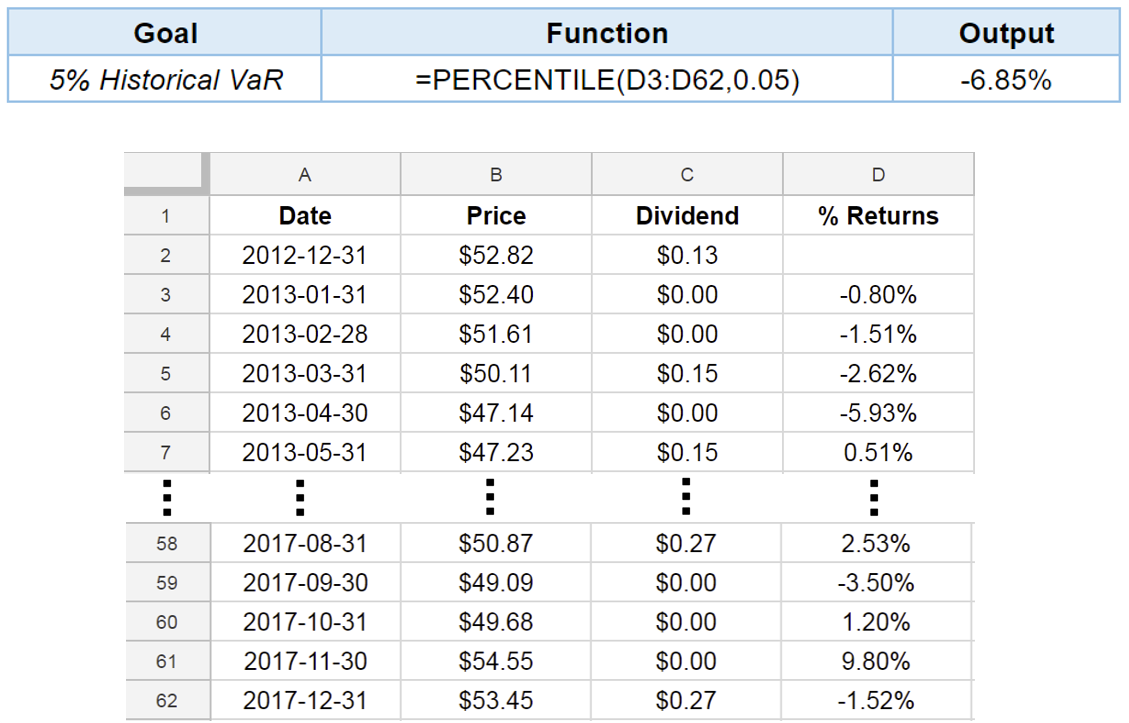
5% Historical VaR with function PERCENTILE()
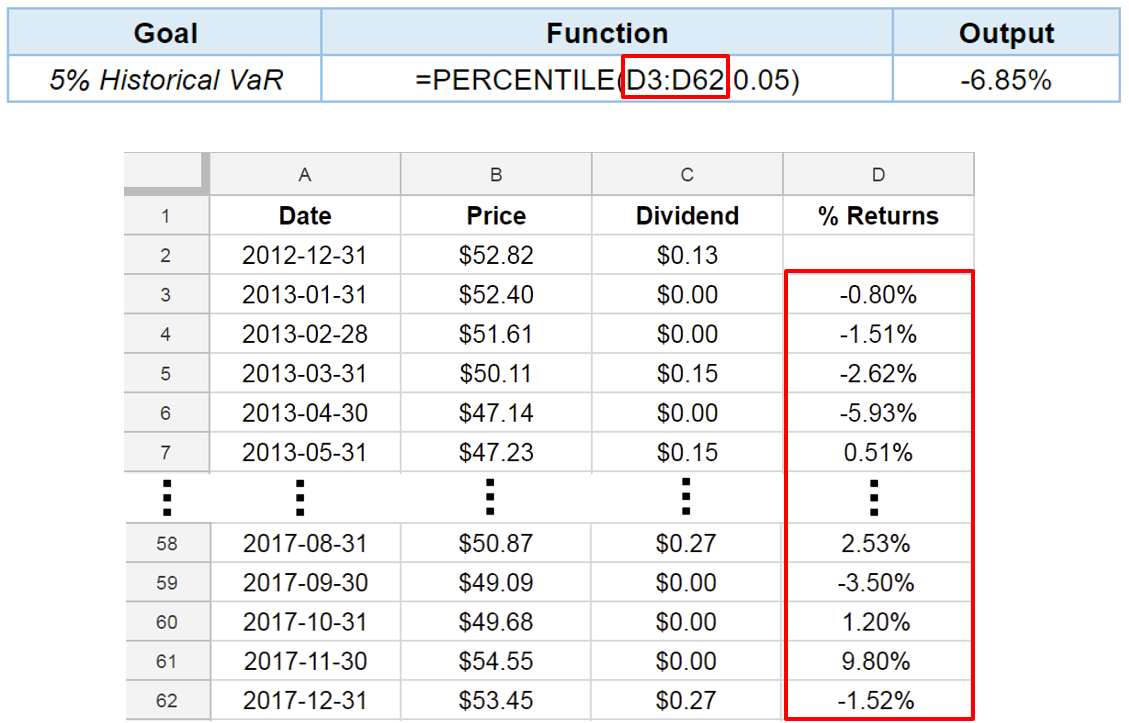
5% Historical VaR with function PERCENTILE()