Performance metrics comparison
Financial Analytics in Google Sheets

David Ardia
Professor in Quantitative Methods for Finance
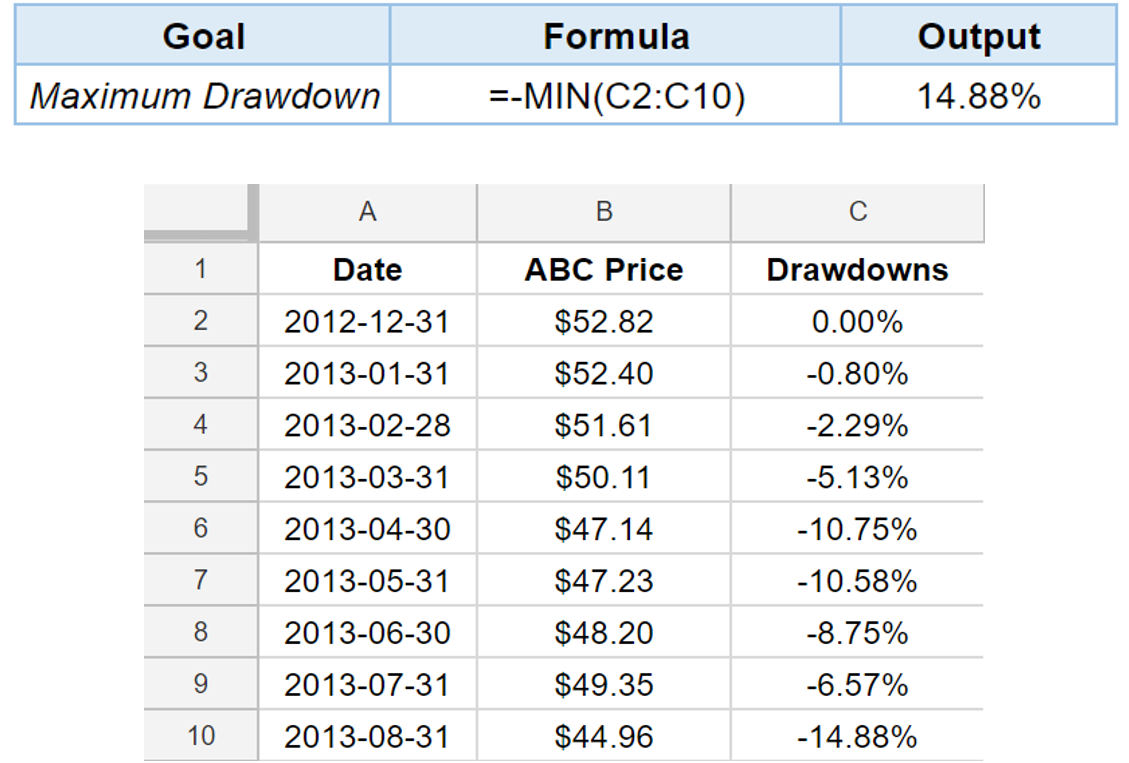
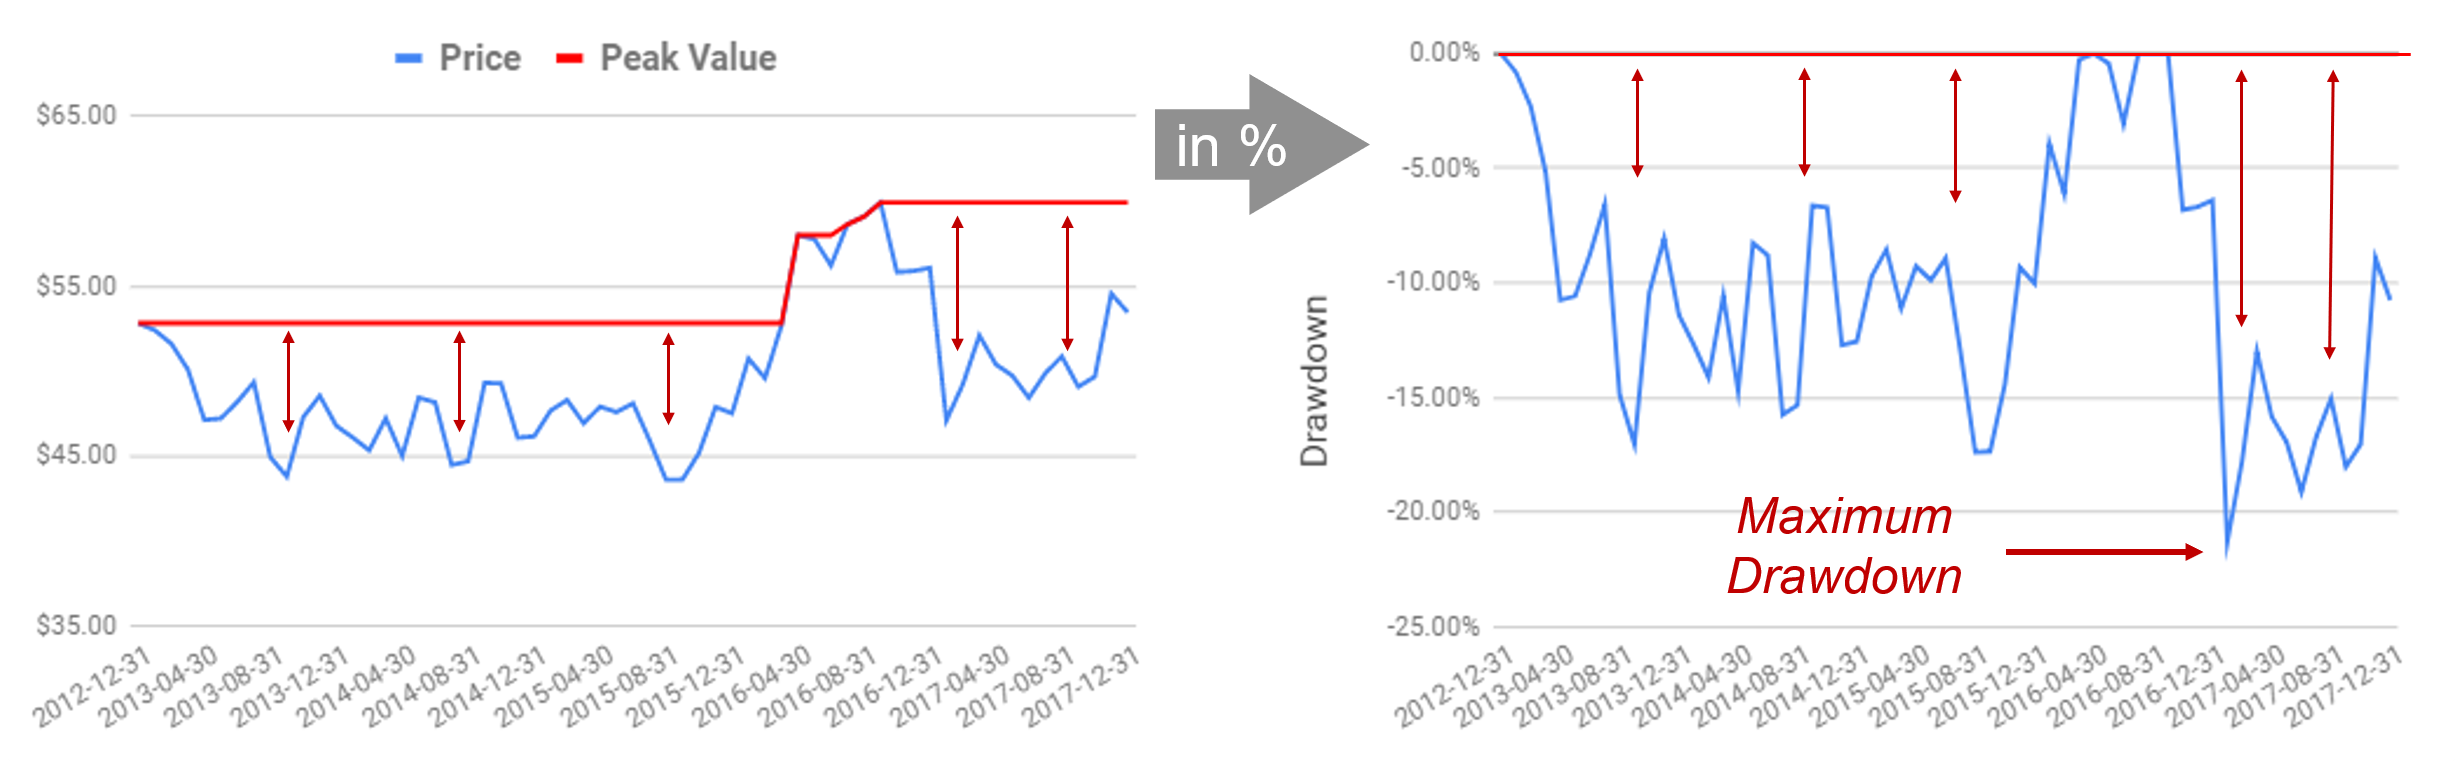
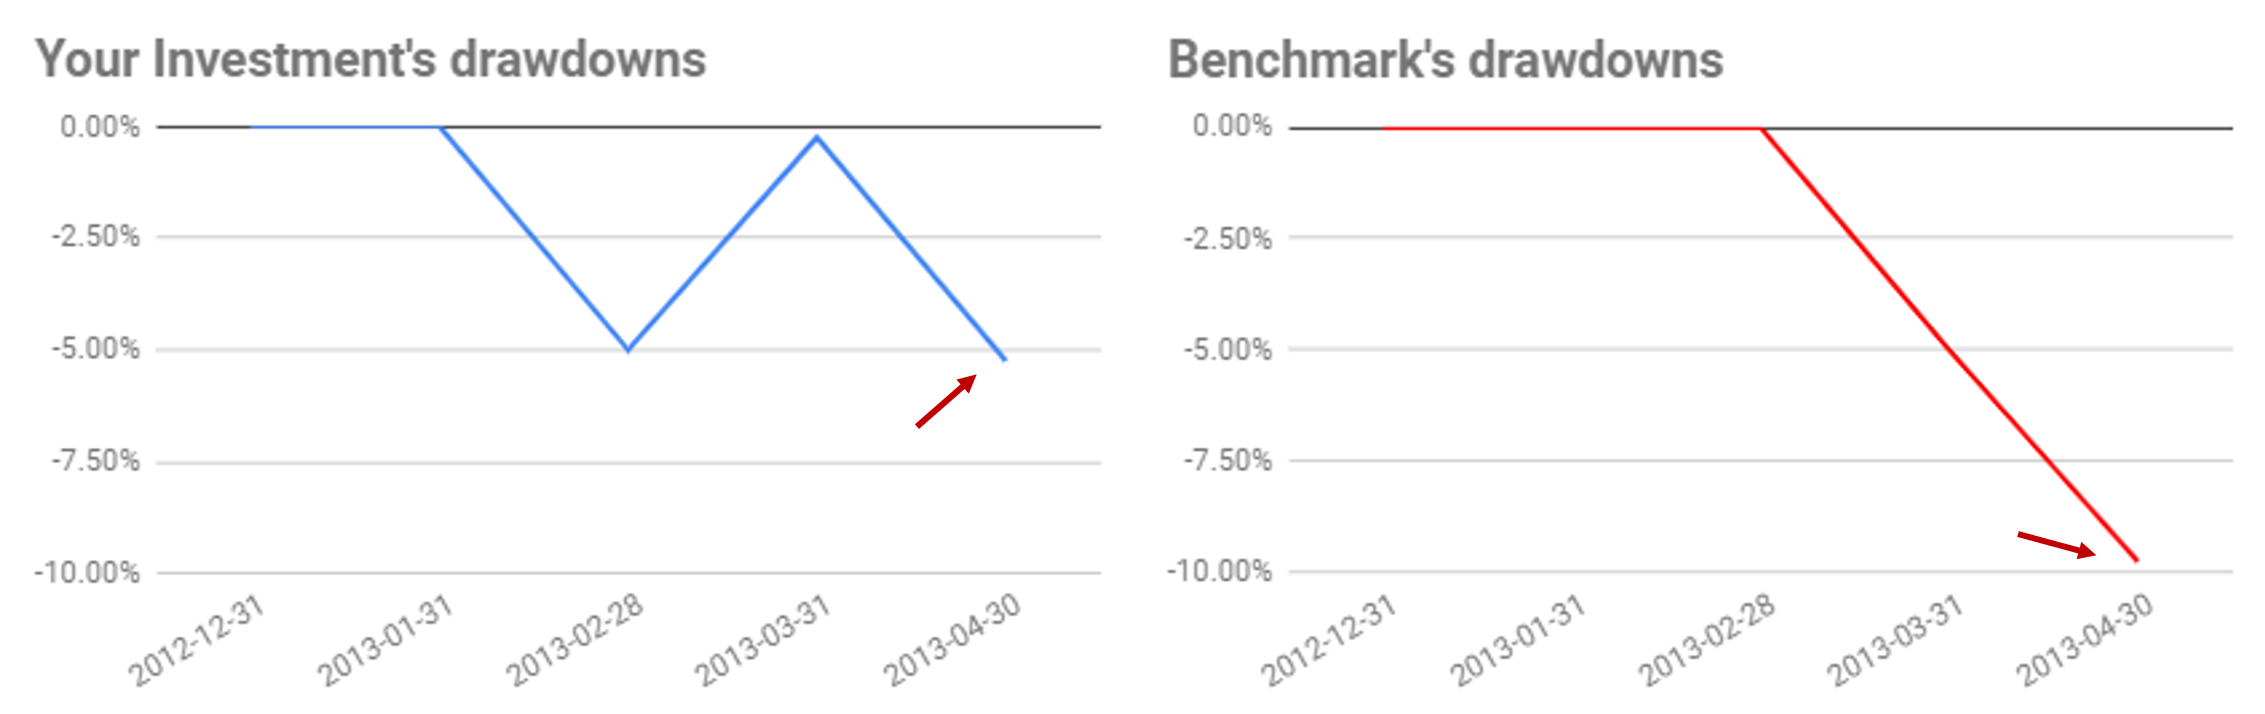
Maximum drawdown
- Drawndown: Peak-to-trough decline of the value of the investment
- Quoted as a percentage of the peak value
Capital preservation
- Capital preservation is crucial for investors
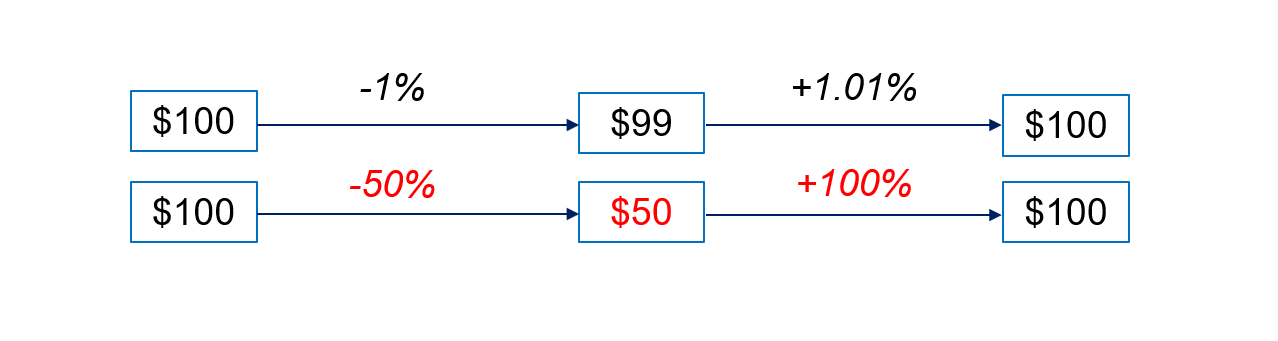
- A drawdown of 50% is dangerous for capital preservation!
Metric of capital preservation
- Maximum drawdown: Metric of capital preservation in your analysis
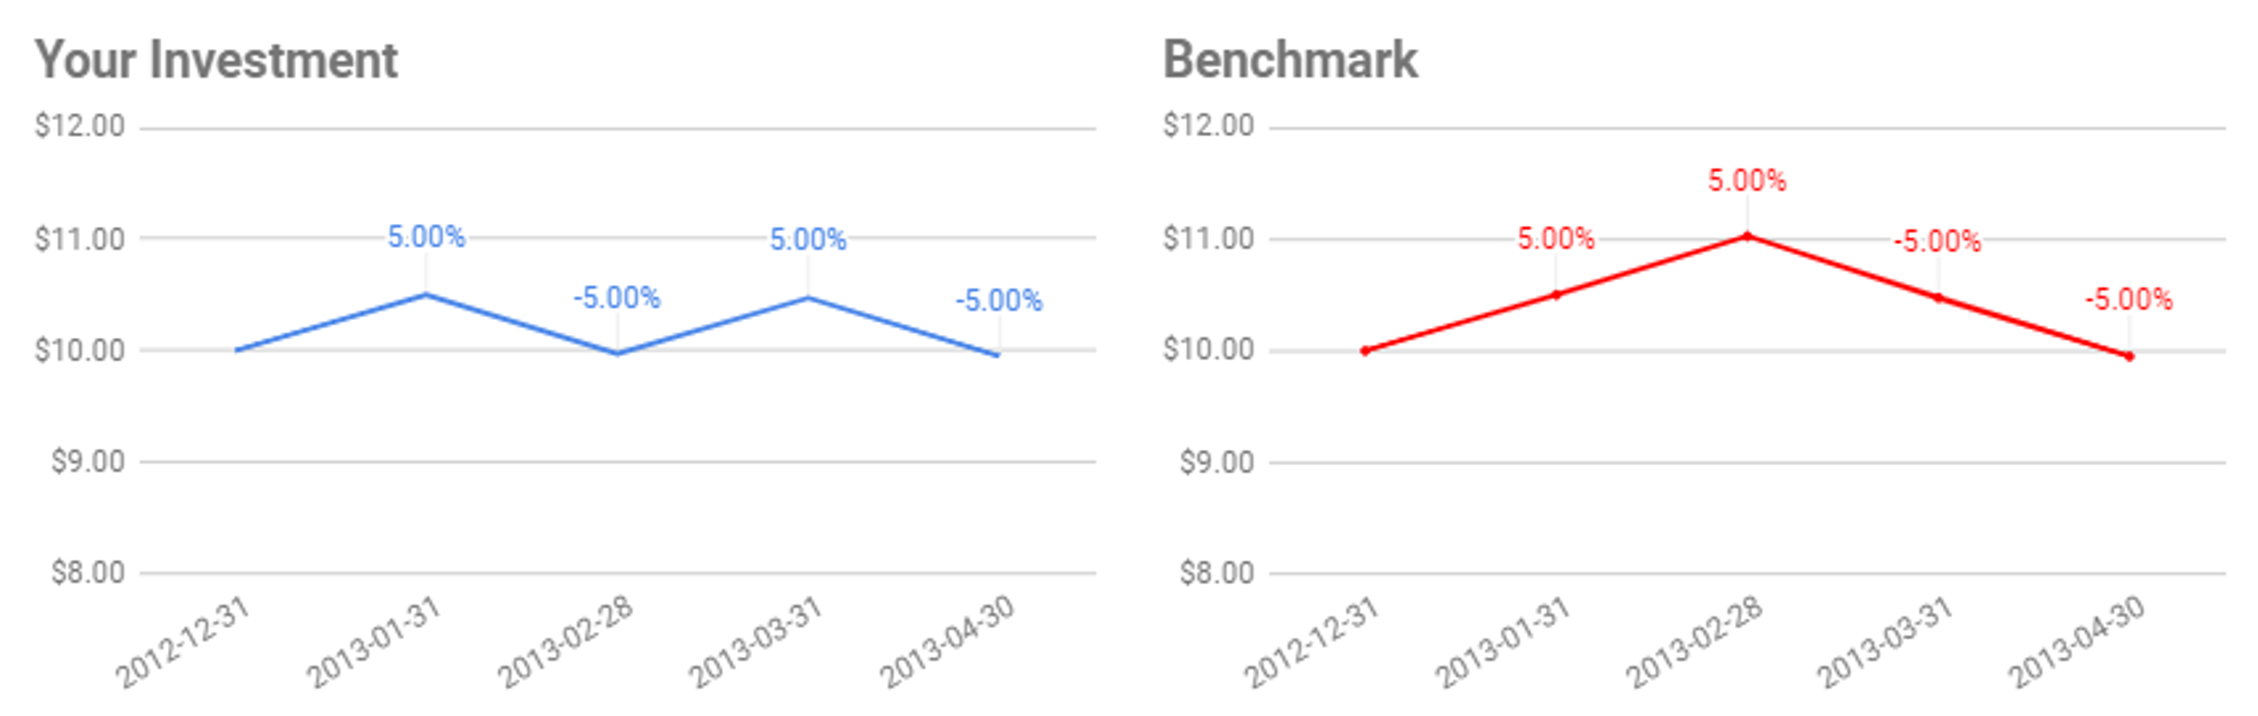
Metric of capital preservation
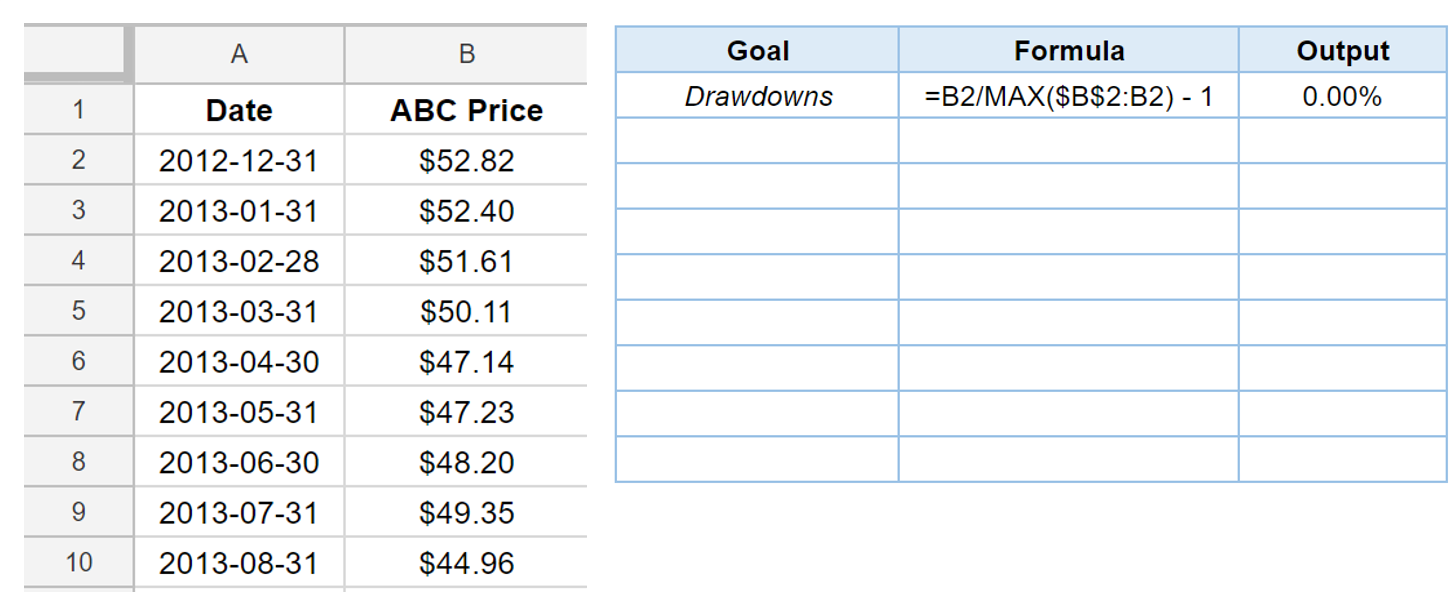
Drawdowns with Google Sheets
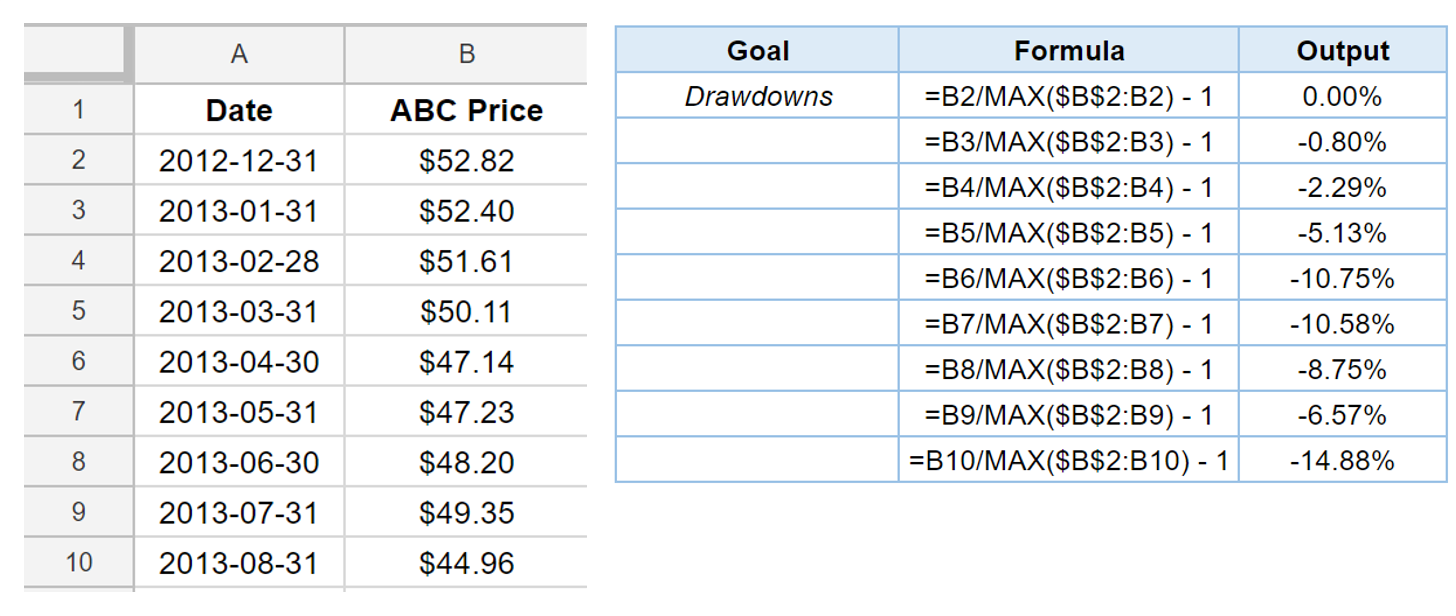
Drawdowns with Google Sheets
Drawdowns with Google Sheets
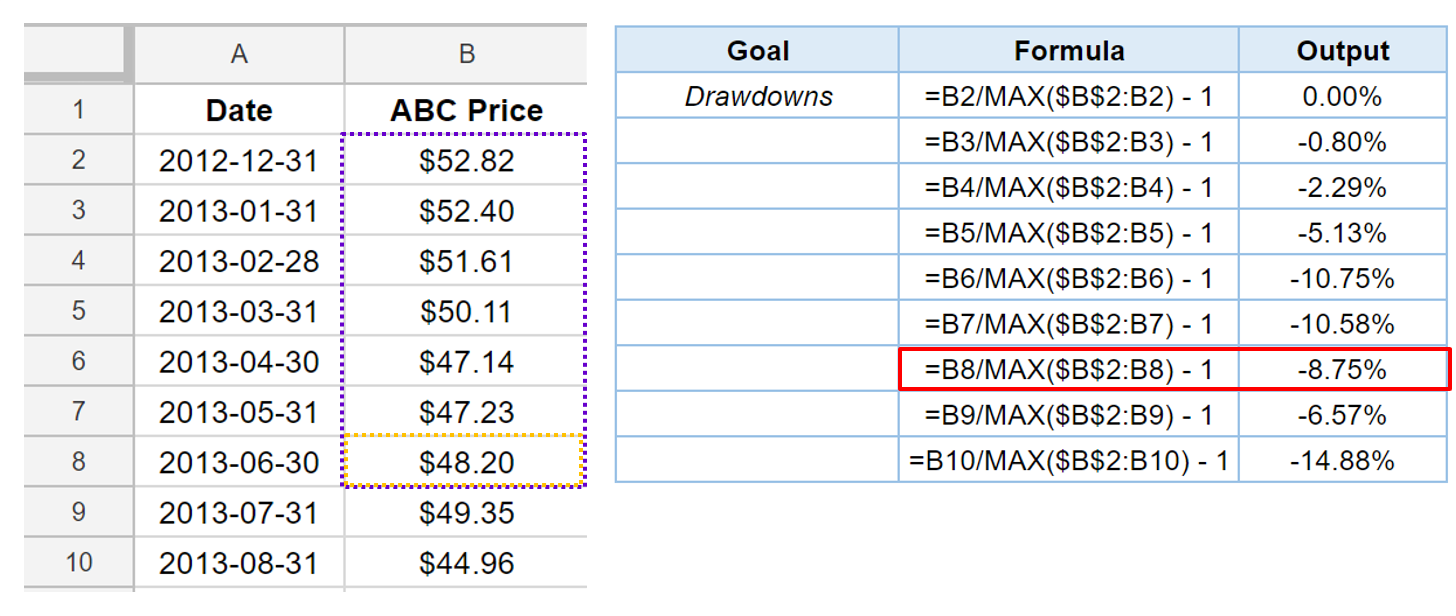
Maximum drawdowns with Google Sheets