Logistic Regression
Machine Learning with PySpark

Andrew Collier
Data Scientist, Fathom Data
Logistic Curve
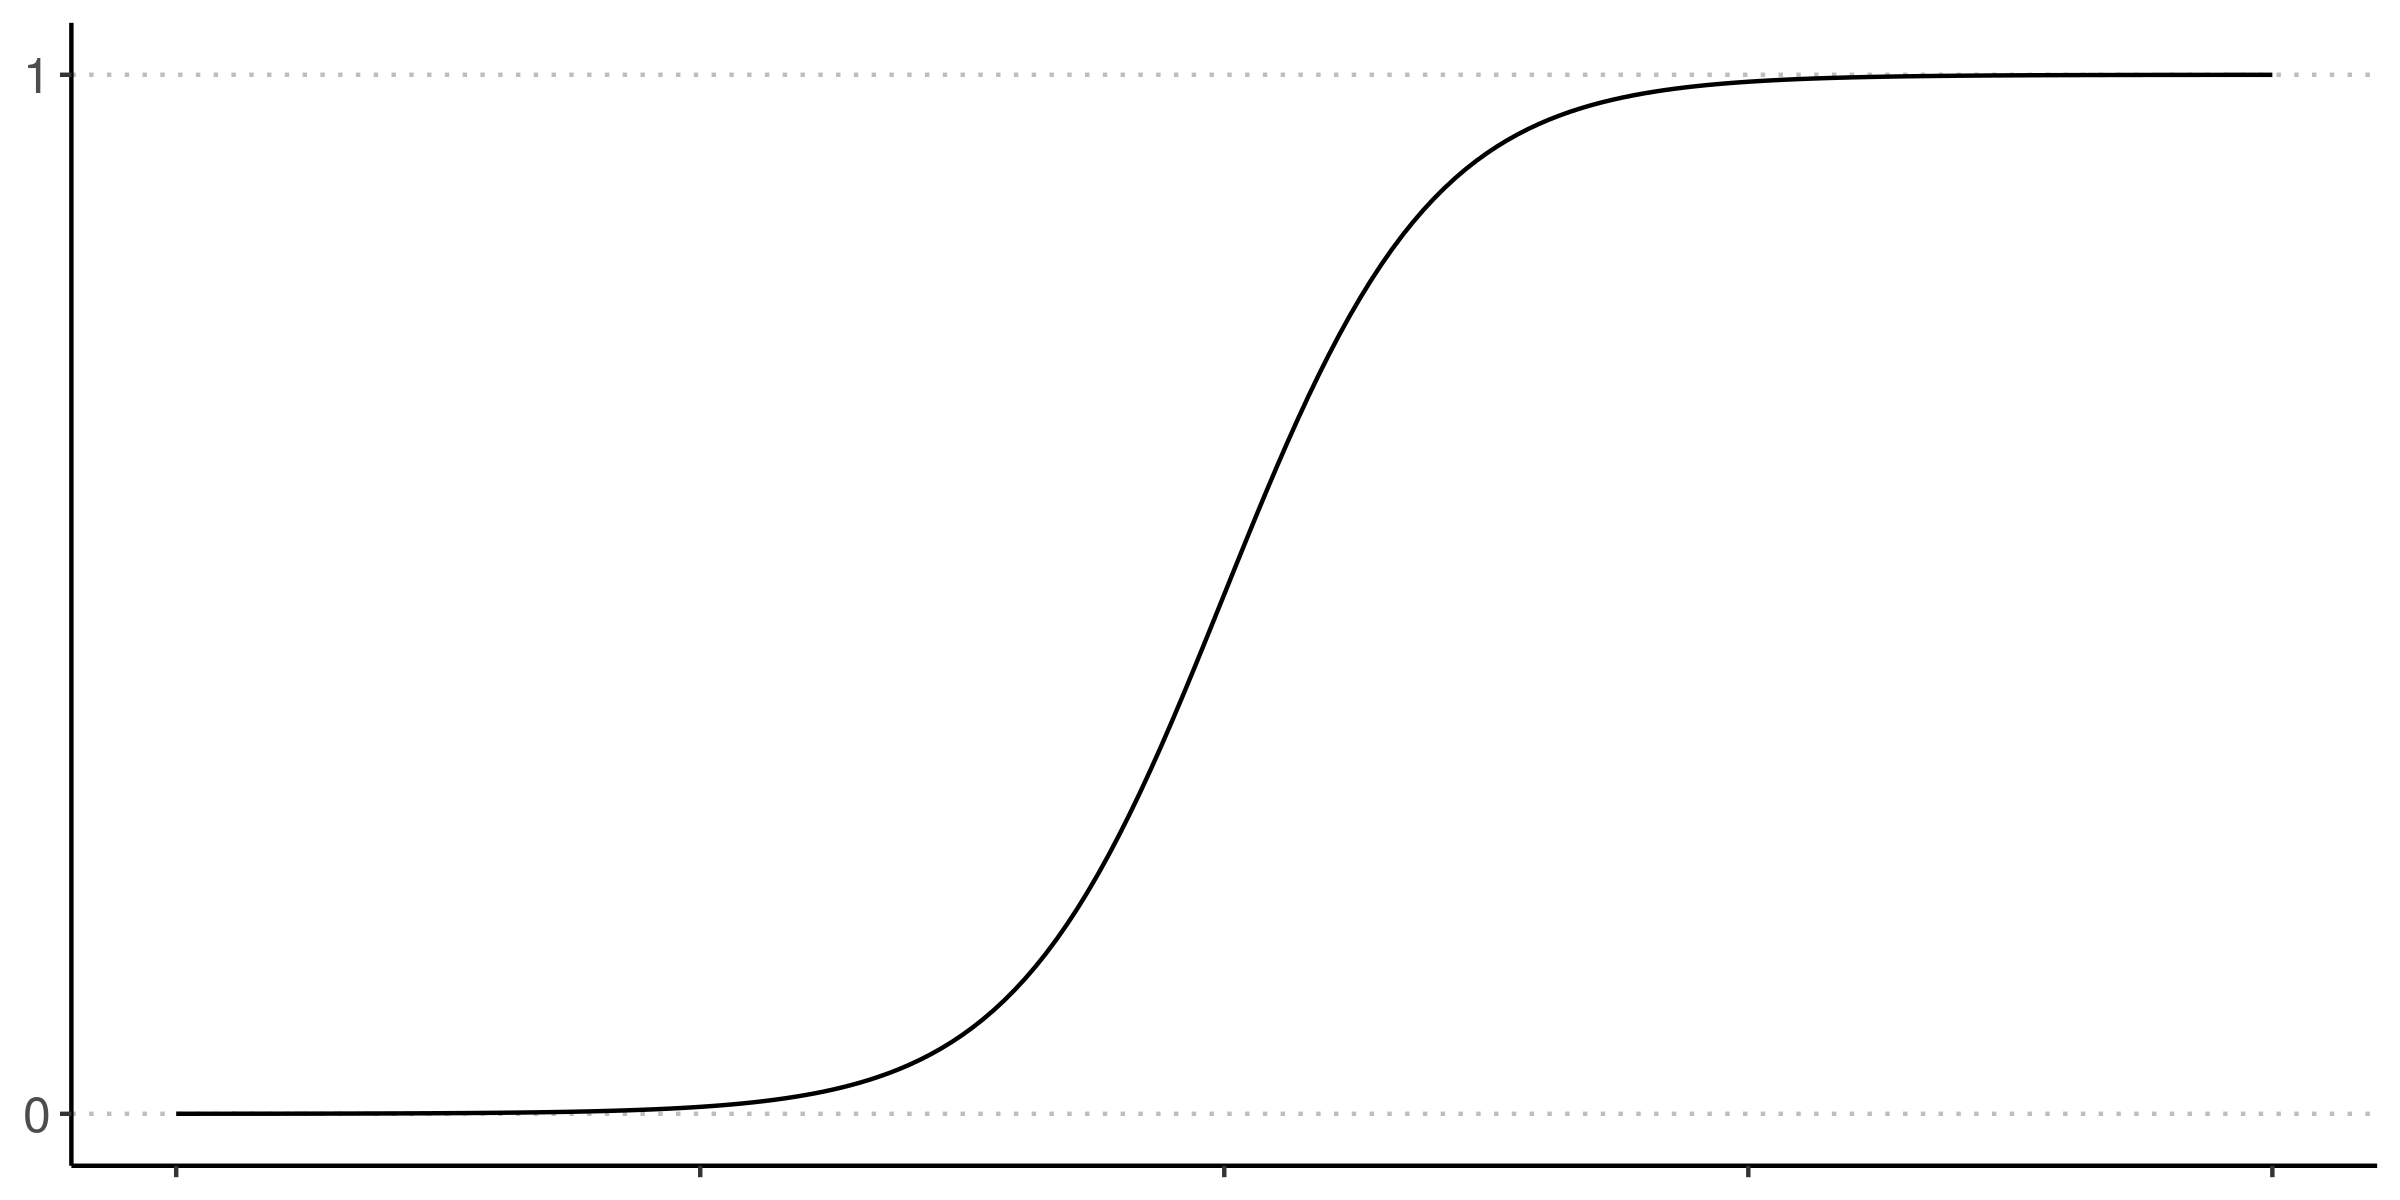
Logistic Curve
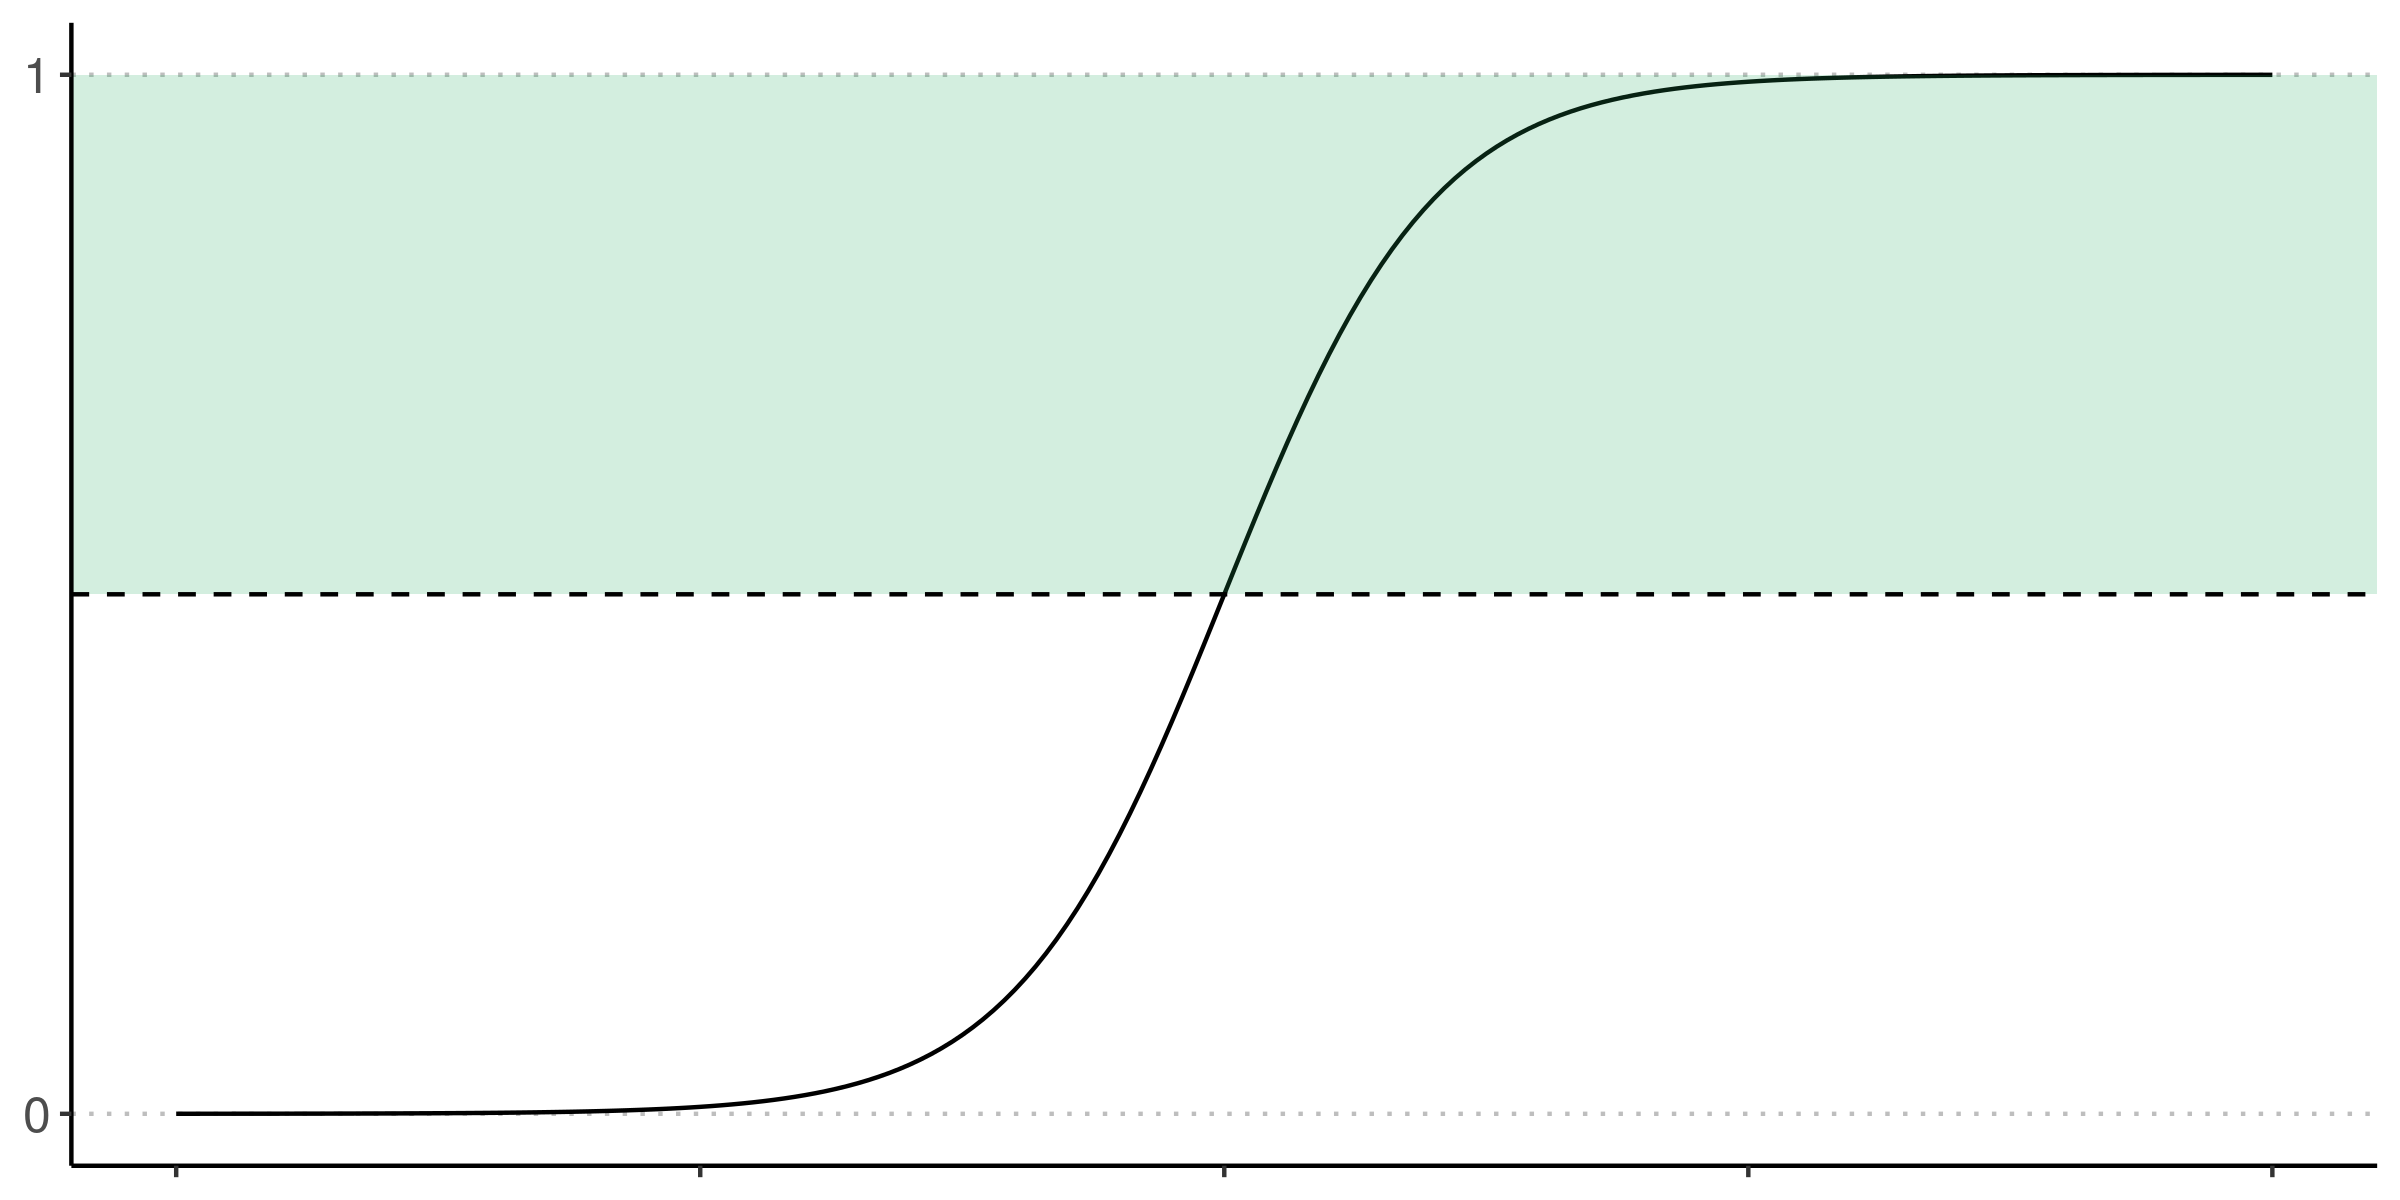
Logistic Curve
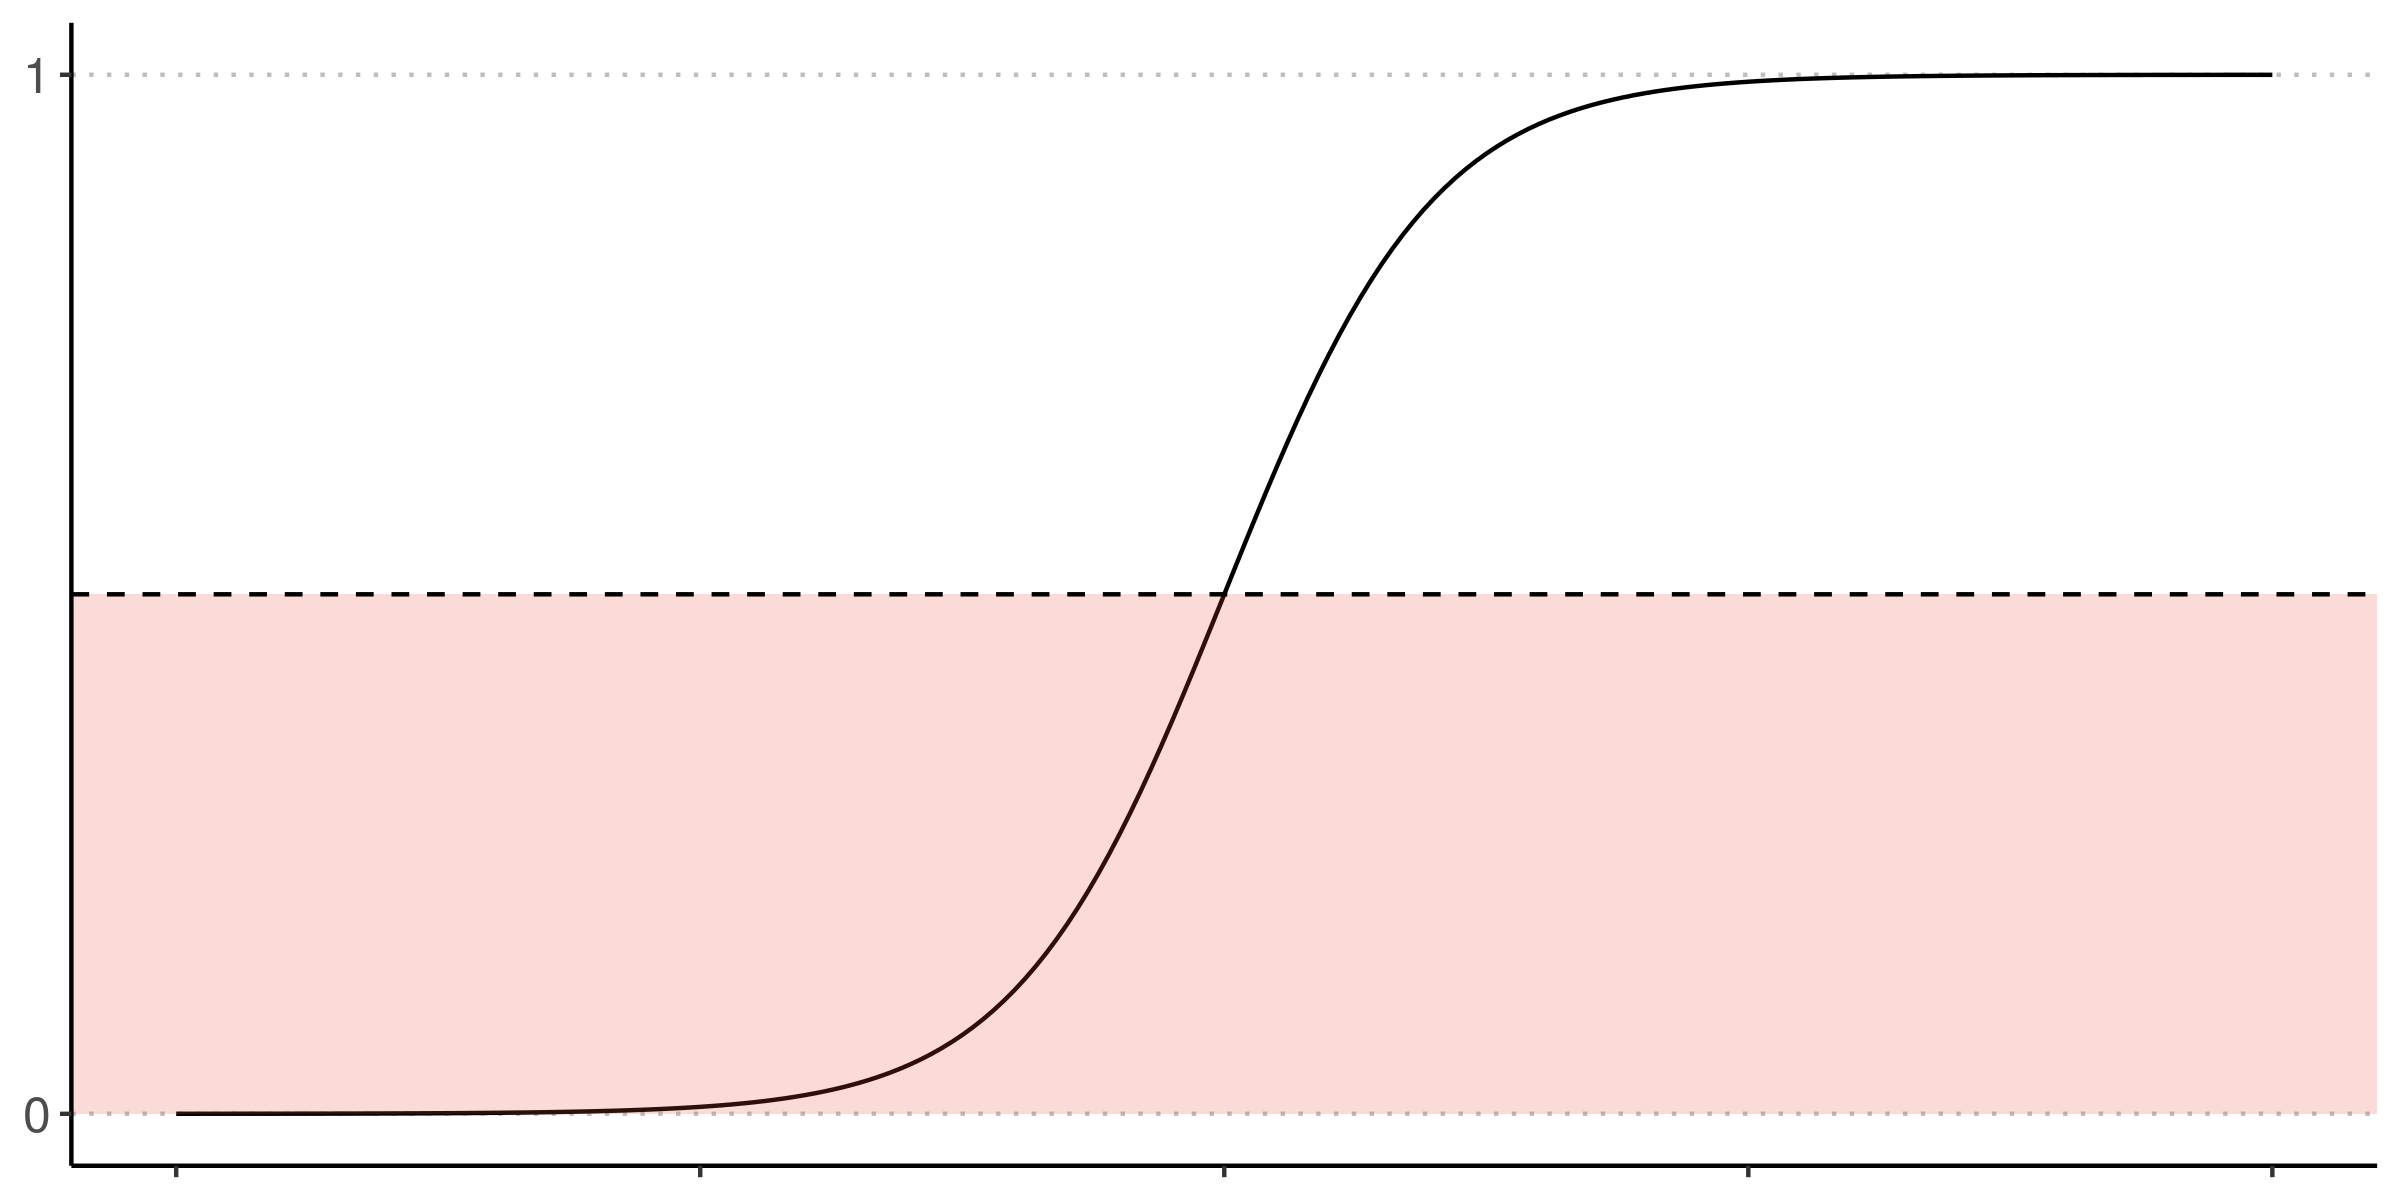
Logistic Curve
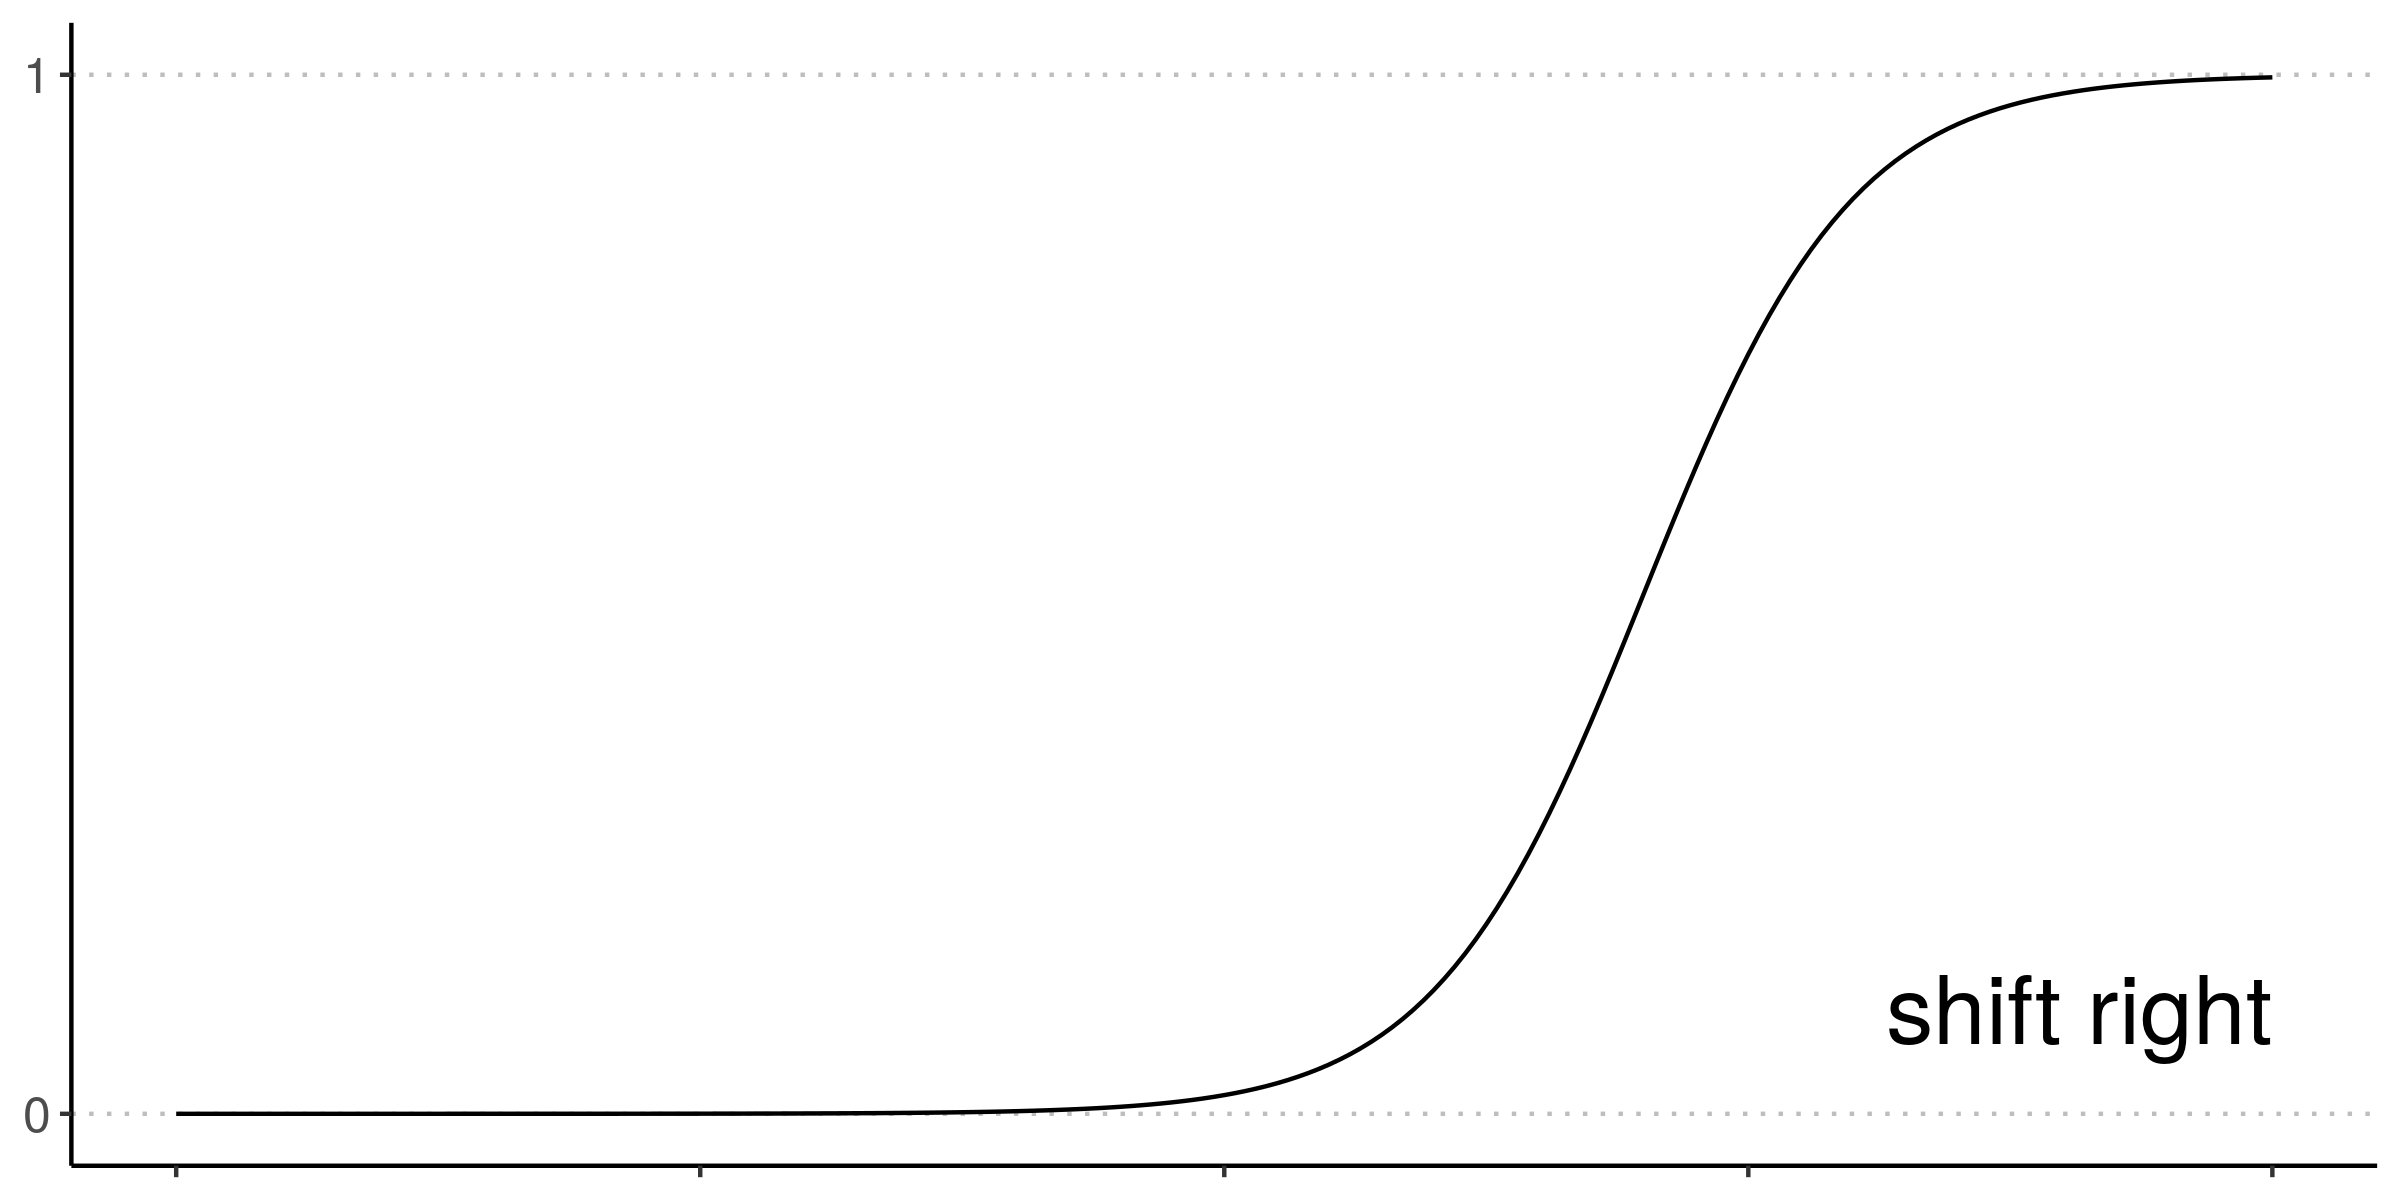
Logistic Curve
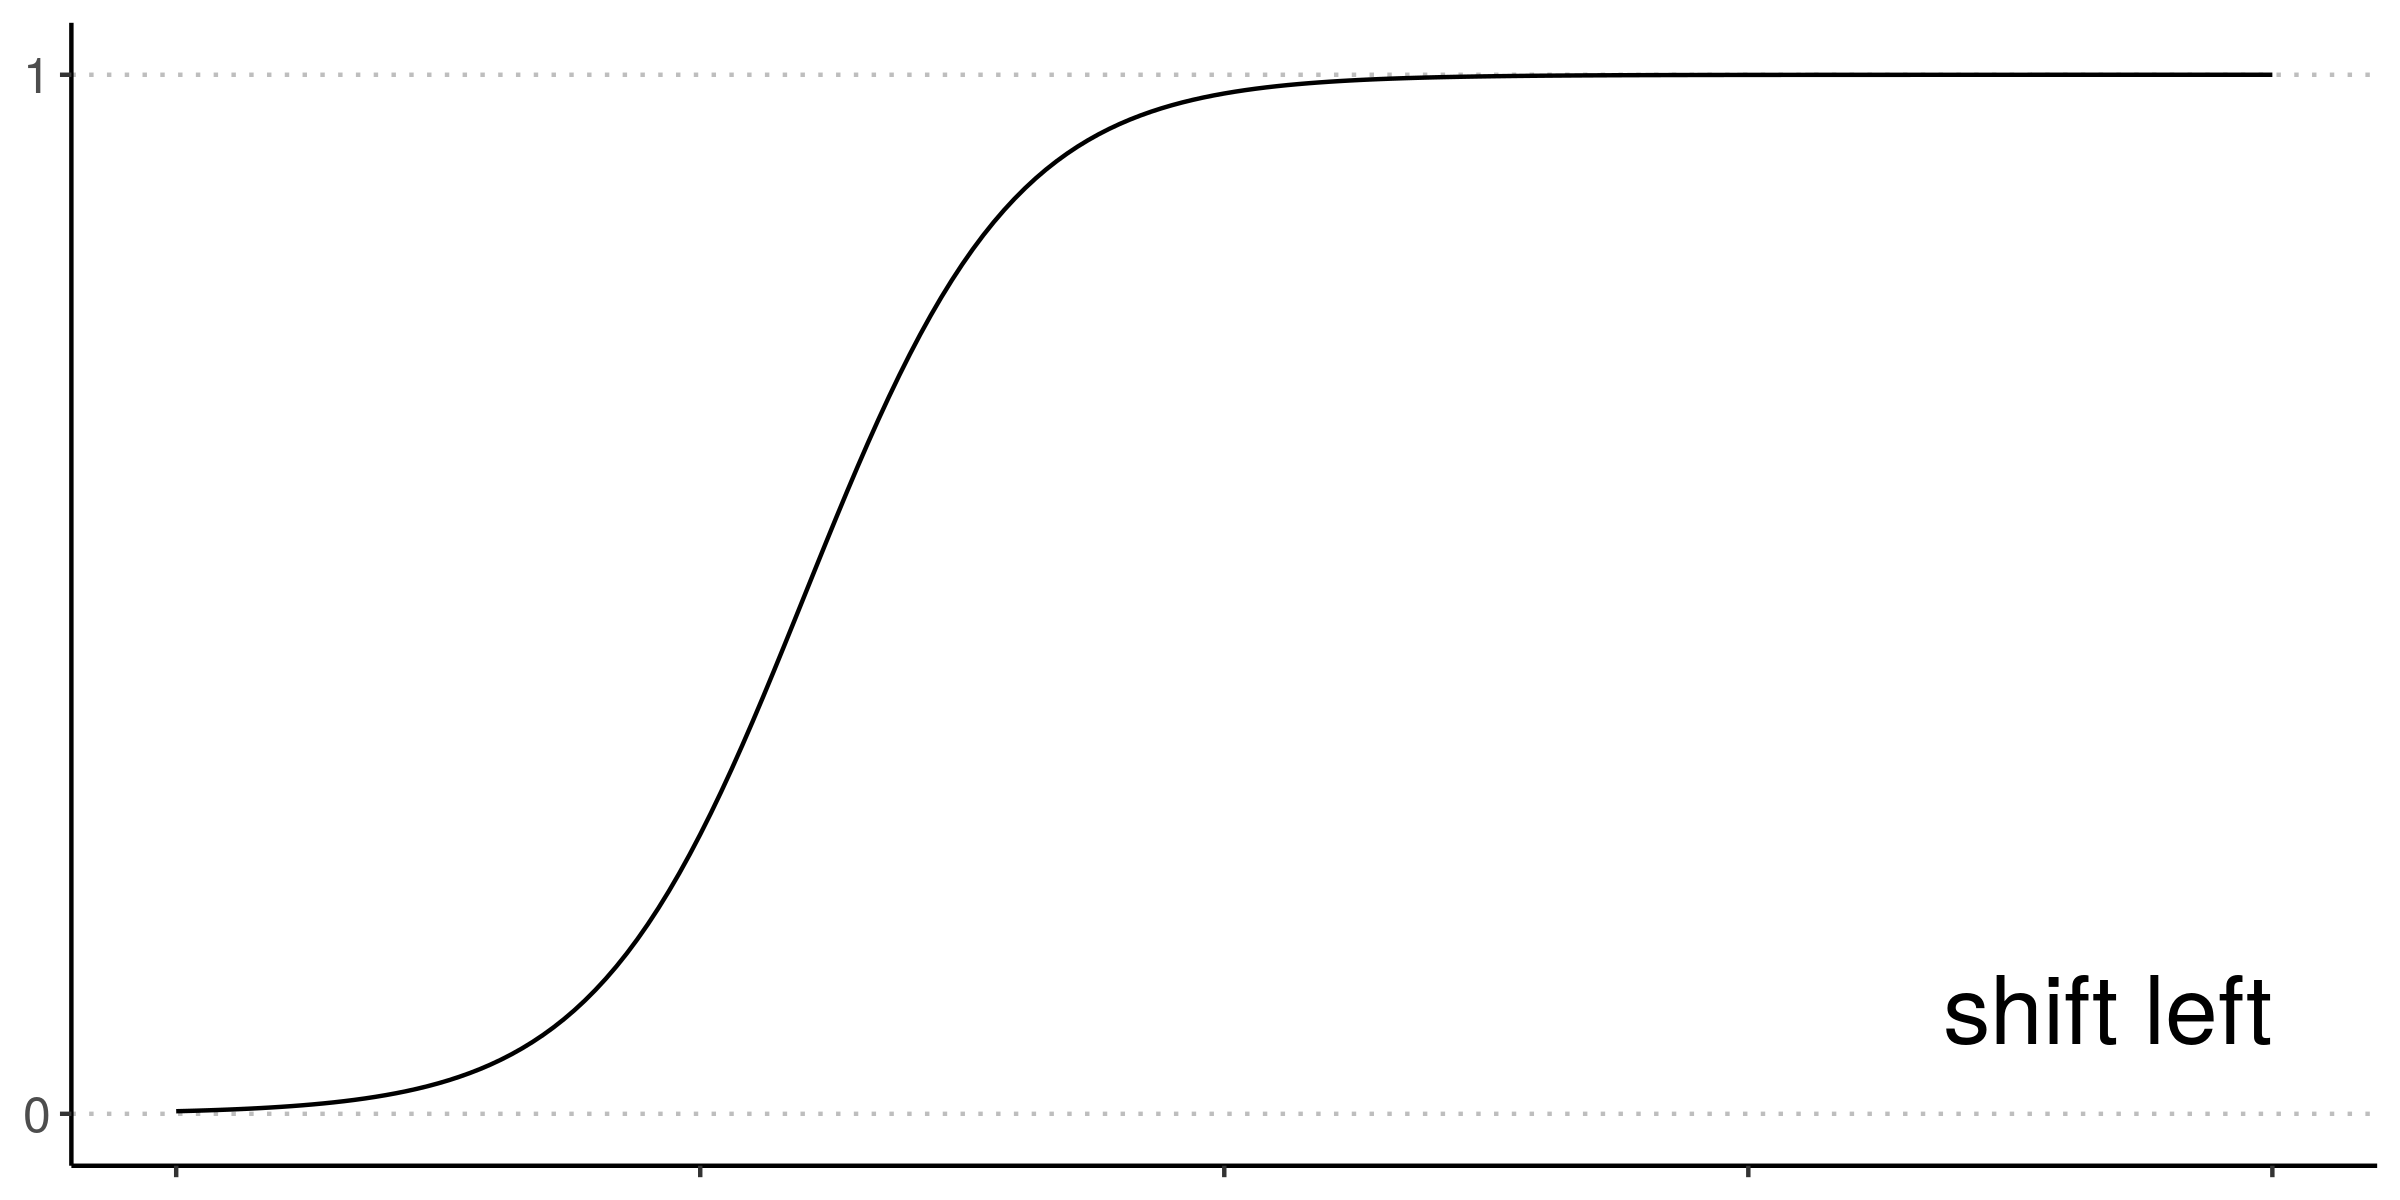
Logistic Curve
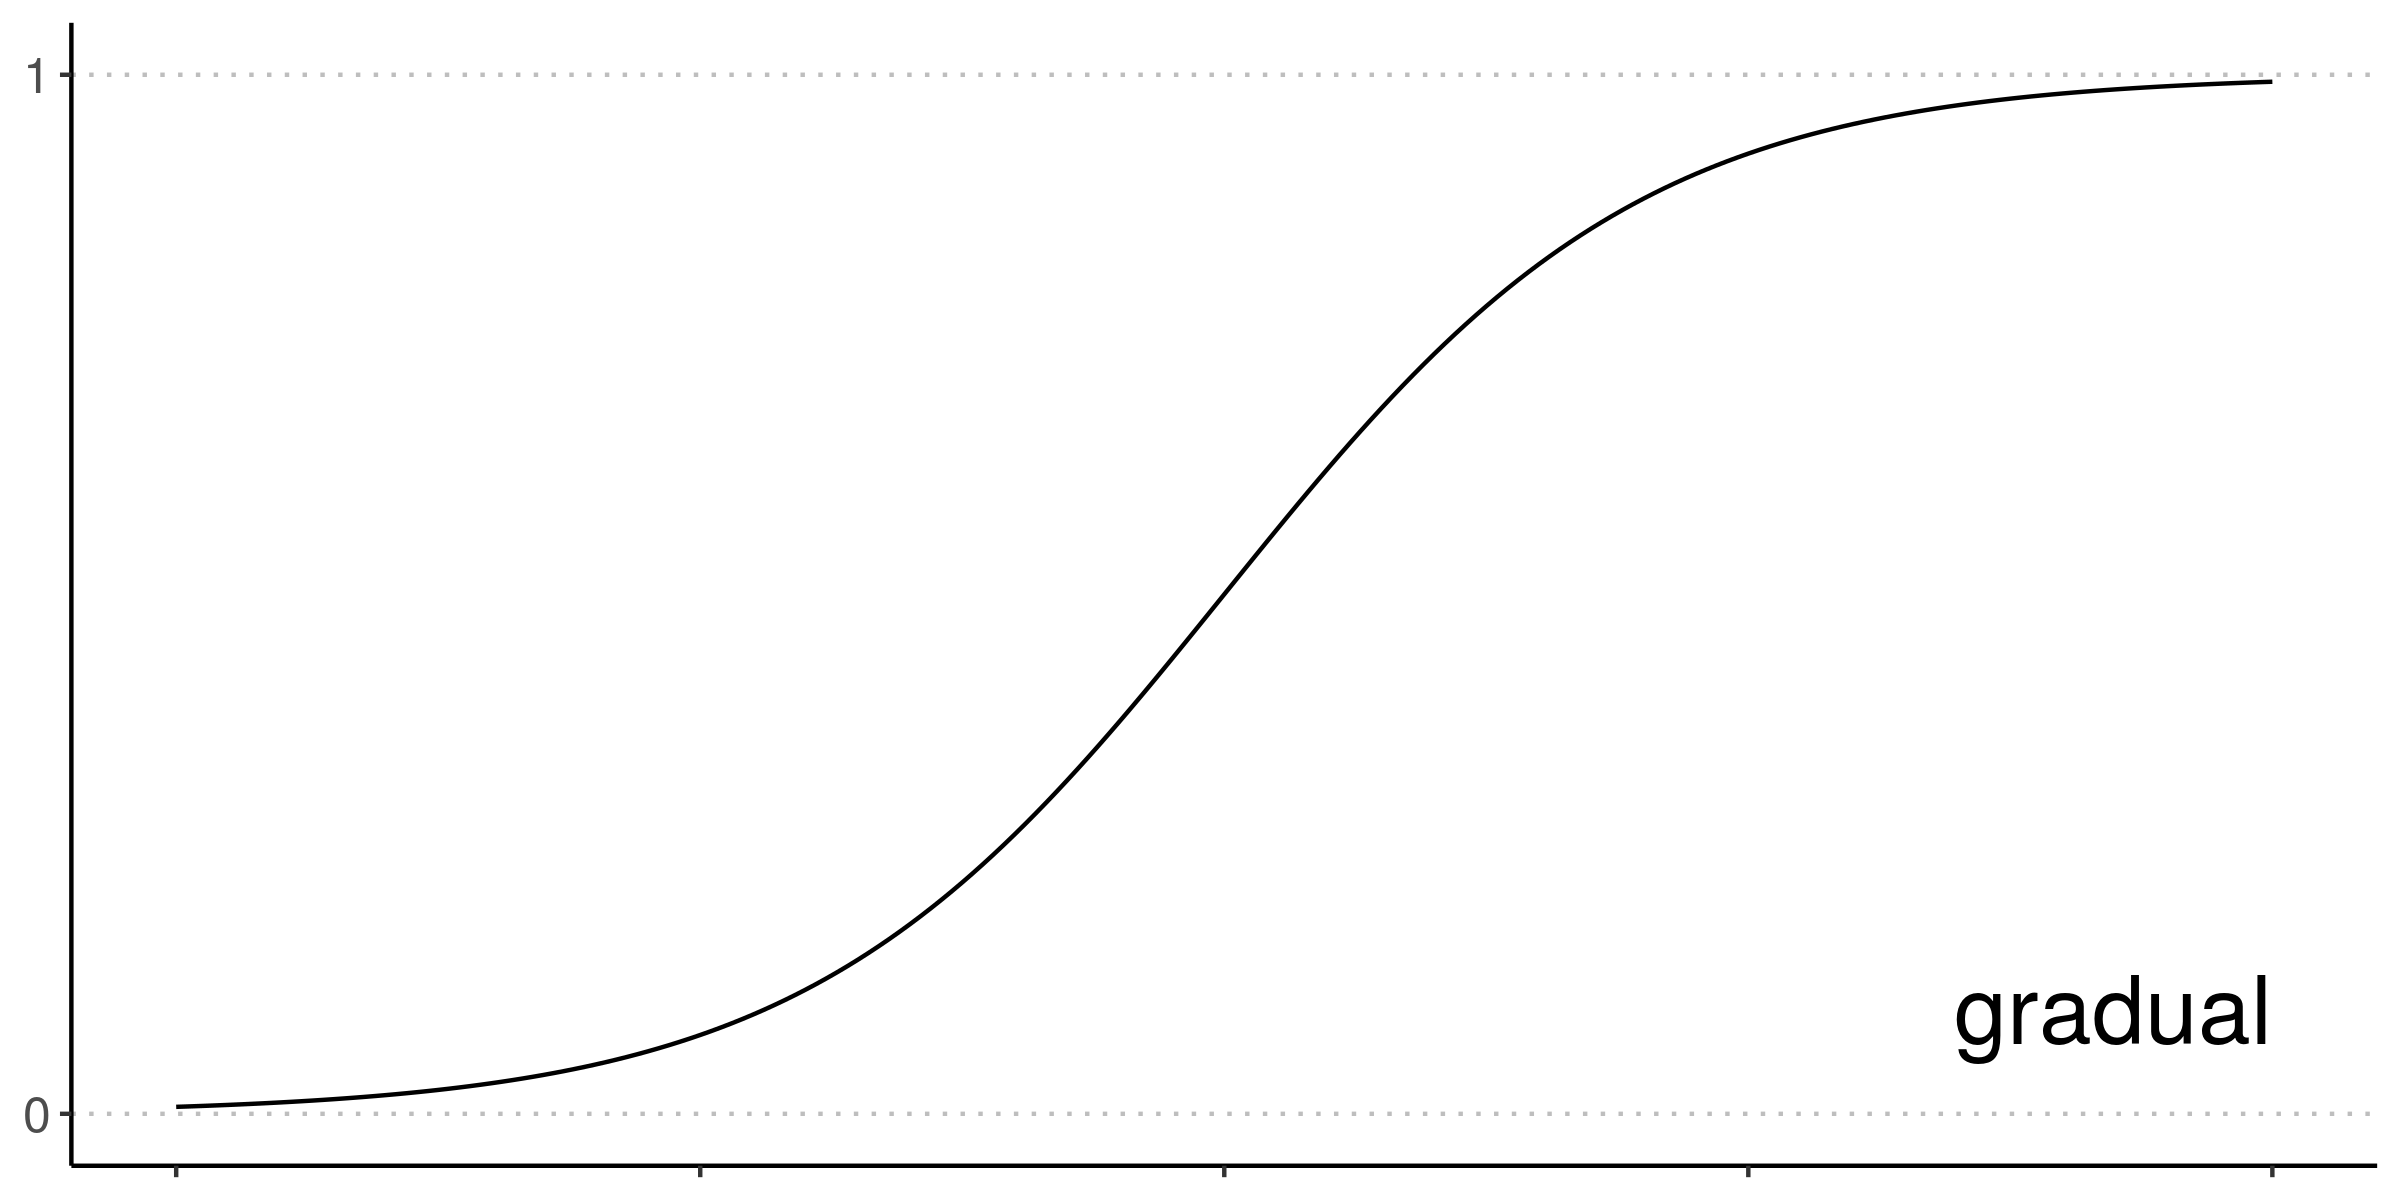
Logistic Curve
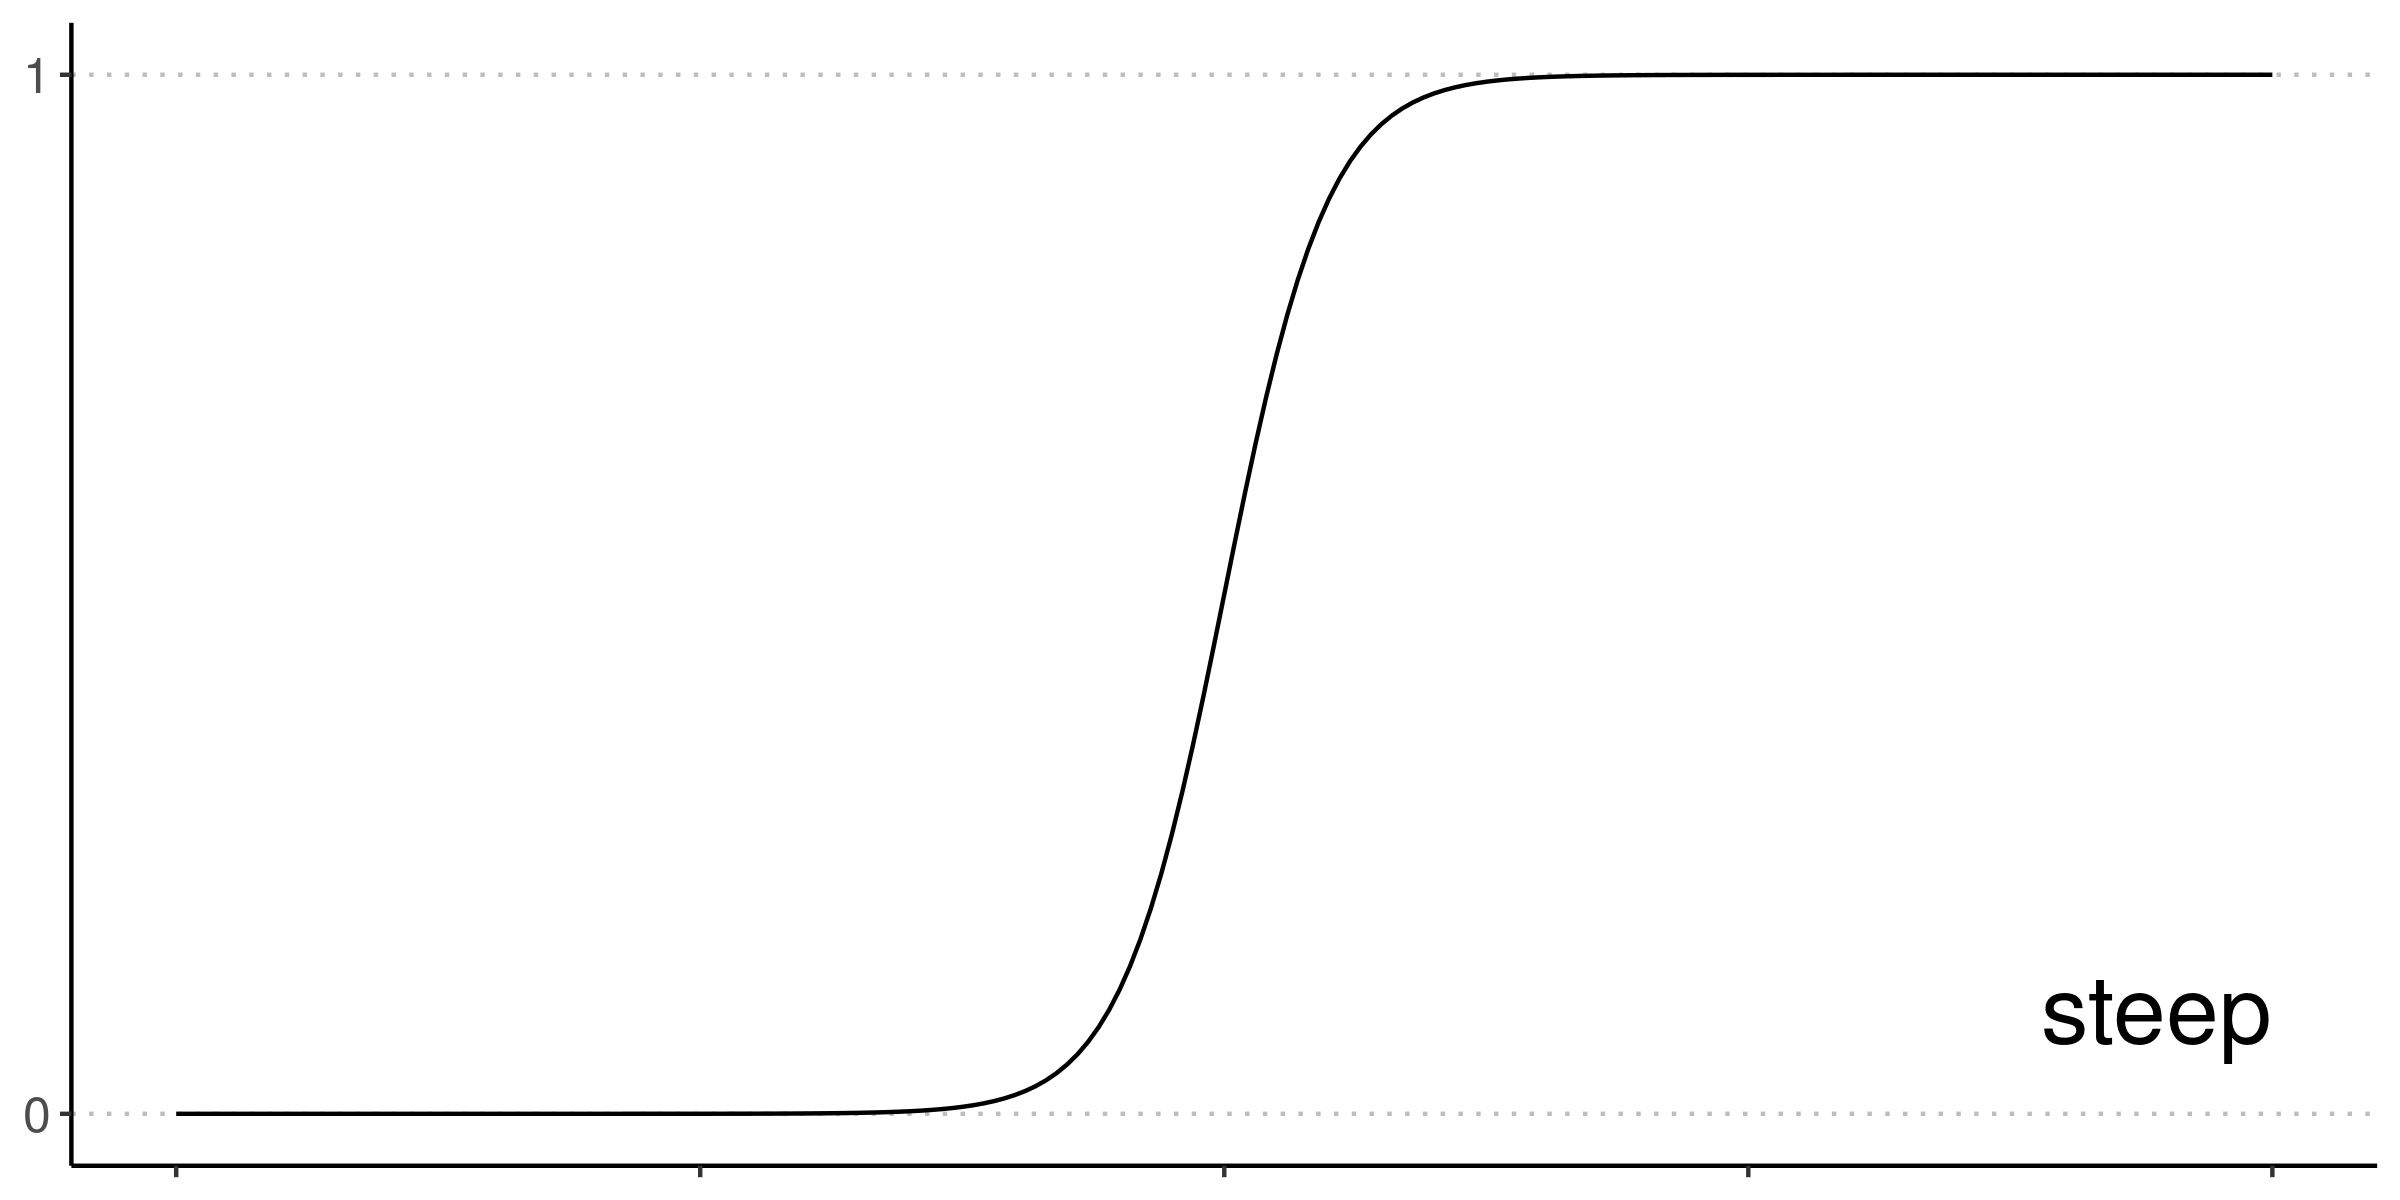
Cars revisited
Prepare for modeling:
- assemble the predictors into a single column (called
features) and - split data into training and testing sets.
+---+----+------+------+----+-----------+----------------------------------+-----+
|cyl|size|mass  |length|rpm |consumption|features                          |label|
+---+----+------+------+----+-----------+----------------------------------+-----+
|6  |3.0 |1451.0|4.775 |5200|9.05       |[6.0,3.0,1451.0,4.775,5200.0,9.05]|1.0  |
|4  |2.2 |1129.0|4.623 |5200|6.53       |[4.0,2.2,1129.0,4.623,5200.0,6.53]|0.0  |
|4  |2.2 |1399.0|4.547 |5600|7.84       |[4.0,2.2,1399.0,4.547,5600.0,7.84]|1.0  |
|4  |1.8 |1147.0|4.343 |6500|7.84       |[4.0,1.8,1147.0,4.343,6500.0,7.84]|0.0  |
|4  |1.6 |1111.0|4.216 |5750|9.05       |[4.0,1.6,1111.0,4.216,5750.0,9.05]|0.0  |
+---+----+------+------+----+-----------+----------------------------------+-----+
Build a Logistic Regression model
from pyspark.ml.classification import LogisticRegression
Create a Logistic Regression classifier.
logistic = LogisticRegression()
Learn from the training data.
logistic = logistic.fit(cars_train)
Predictions
prediction = logistic.transform(cars_test)
+-----+----------+---------------------------------------+
|label|prediction|probability                            |
+-----+----------+---------------------------------------+
|0.0  |0.0       |[0.8683802216422138,0.1316197783577862]|
|0.0  |1.0       |[0.1343792056399585,0.8656207943600416]|
|0.0  |0.0       |[0.9773546766387631,0.0226453233612368]|
|1.0  |1.0       |[0.0170508265586195,0.9829491734413806]|
|1.0  |0.0       |[0.6122241729292978,0.3877758270707023]|
+-----+----------+---------------------------------------+
Precision and recall
How well does model work on testing data?
Consult the confusion matrix.
+-----+----------+-----+
|label|prediction|count|
+-----+----------+-----+
|  1.0|       1.0|    8| - TP (true positive)
|  0.0|       1.0|    4| - FP (false positive)
|  1.0|       0.0|    2| - FN (false negative)
|  0.0|       0.0|   10| - TN (true negative)
+-----+----------+-----+
# Precision (positive)
TP / (TP + FP)
0.6666666666666666
# Recall (positive)
TP / (TP + FN)
0.8
Weighted metrics
from pyspark.ml.evaluation import MulticlassClassificationEvaluator evaluator = MulticlassClassificationEvaluator()evaluator.evaluate(prediction, {evaluator.metricName: 'weightedPrecision'})
0.7638888888888888
Other metrics:
weightedRecallaccuracyf1
ROC and AUC
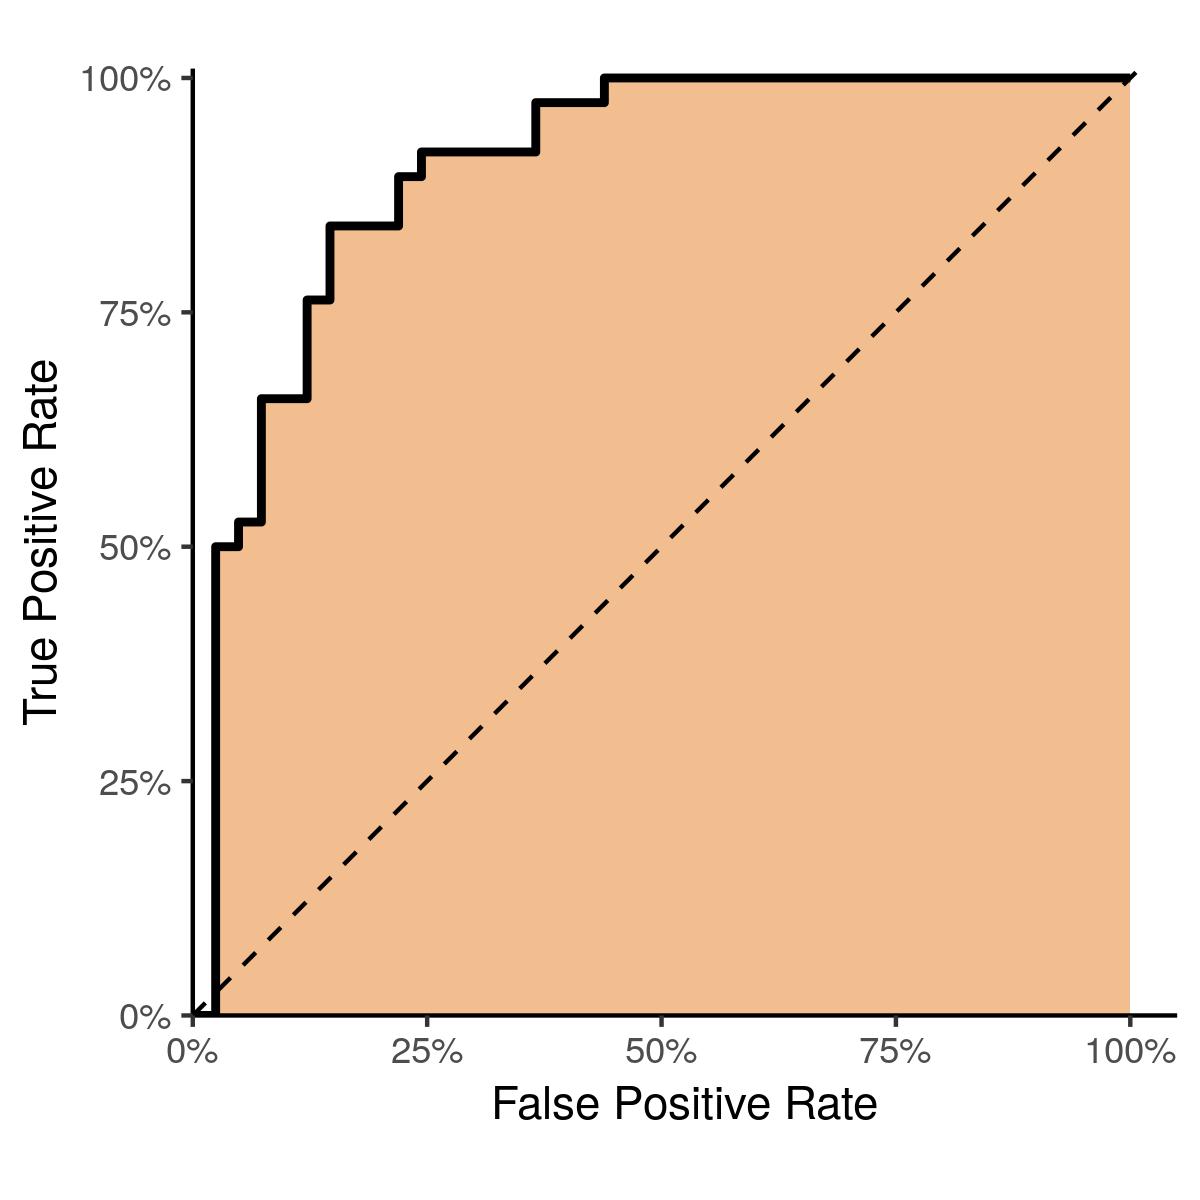
ROC = "Receiver Operating Characteristic"
- TP versus FP
- threshold = 0 (top right)
- threshold = 1 (bottom left)
AUC = "Area under the curve"
- ideally AUC = 1
Let's do Logistic Regression!
Machine Learning with PySpark

